33
/de/
AIzaSyAYiBZKx7MnpbEhh9jyipgxe19OcubqV5w
August 1, 2025
270091
Turkey
TUR
true
2
1
Stocks traded, turnover ratio of domestic shares (%)
2016,2015,2014,2013,2012,2011,2010,2009,2008,2007,2006,2005,2004,2003,2002,2001,2000,1999,1998,1997,1996,1995,1994
Download
Bibliothek der Globalstatistik →Turkey →

Stocks traded, turnover ratio of domestic shares (%)

Diese Statistik in anderen Ländern:

Arab WorldArgentinaArmeniaAustraliaAustriaBahrainBangladeshBarbadosBelgiumBermudaBoliviaBotswanaBrazilBulgariaCanadaCaribbean small statesCayman IslandsCentral Europe and the BalticsChannel IslandsChileChinaColombiaCosta RicaCote d'IvoireCroatiaCyprusCzech RepublicDenmarkEarly-demographic dividendEast Asia & PacificEast Asia & Pacific (excluding high income)East Asia & Pacific (IDA & IBRD countries)EcuadorEgypt, Arab Rep.El SalvadorEuro areaEurope & Central AsiaEurope & Central Asia (excluding high income)Europe & Central Asia (IDA & IBRD countries)European UnionFijiFinlandFragile and conflict affected situationsFranceGeorgiaGermanyGhanaGreeceGuyanaHeavily indebted poor countries (HIPC)High incomeHong Kong SAR, ChinaHungaryIBRD onlyIDA & IBRD totalIDA blendIDA onlyIDA totalIndiaIndonesiaIran, Islamic Rep.IrelandIsraelItalyJamaicaJapanJordanKazakhstanKenyaKorea, Rep.KuwaitKyrgyz RepublicLate-demographic dividendLatin America & Caribbean Latin America & Caribbean (excluding high income)Latin America & the Caribbean (IDA & IBRD countries)Least developed countries: UN classificationLebanonLow & middle incomeLow incomeLower middle incomeLuxembourgMacedonia, FYRMalawiMalaysiaMaltaMauritiusMexicoMiddle East & North AfricaMiddle East & North Africa (excluding high income)Middle East & North Africa (IDA & IBRD countries)Middle incomeMoldovaMongoliaMontenegroMoroccoNamibiaNetherlandsNew ZealandNigeriaNorth AmericaNorwayOECD membersOmanOther small statesPacific island small statesPakistanPanamaPapua New GuineaParaguayPeruPhilippinesPolandPortugalPost-demographic dividendPre-demographic dividendQatarRomaniaRussian FederationSaudi ArabiaSerbiaSingaporeSlovak RepublicSloveniaSmall statesSouth AfricaSouth AsiaSouth Asia (IDA & IBRD)SpainSri LankaSt. Kitts and NevisSub-Saharan Africa Sub-Saharan Africa (excluding high income)Sub-Saharan Africa (IDA & IBRD countries)SwazilandSwedenSwitzerlandTanzaniaThailandTrinidad and TobagoTunisiaTurkeyUgandaUkraineUnited Arab EmiratesUnited KingdomUnited StatesUpper middle incomeUruguayUzbekistanVenezuela, RBVietnamWest Bank and GazaWorldZambiaZimbabwe

Zeitlinie:

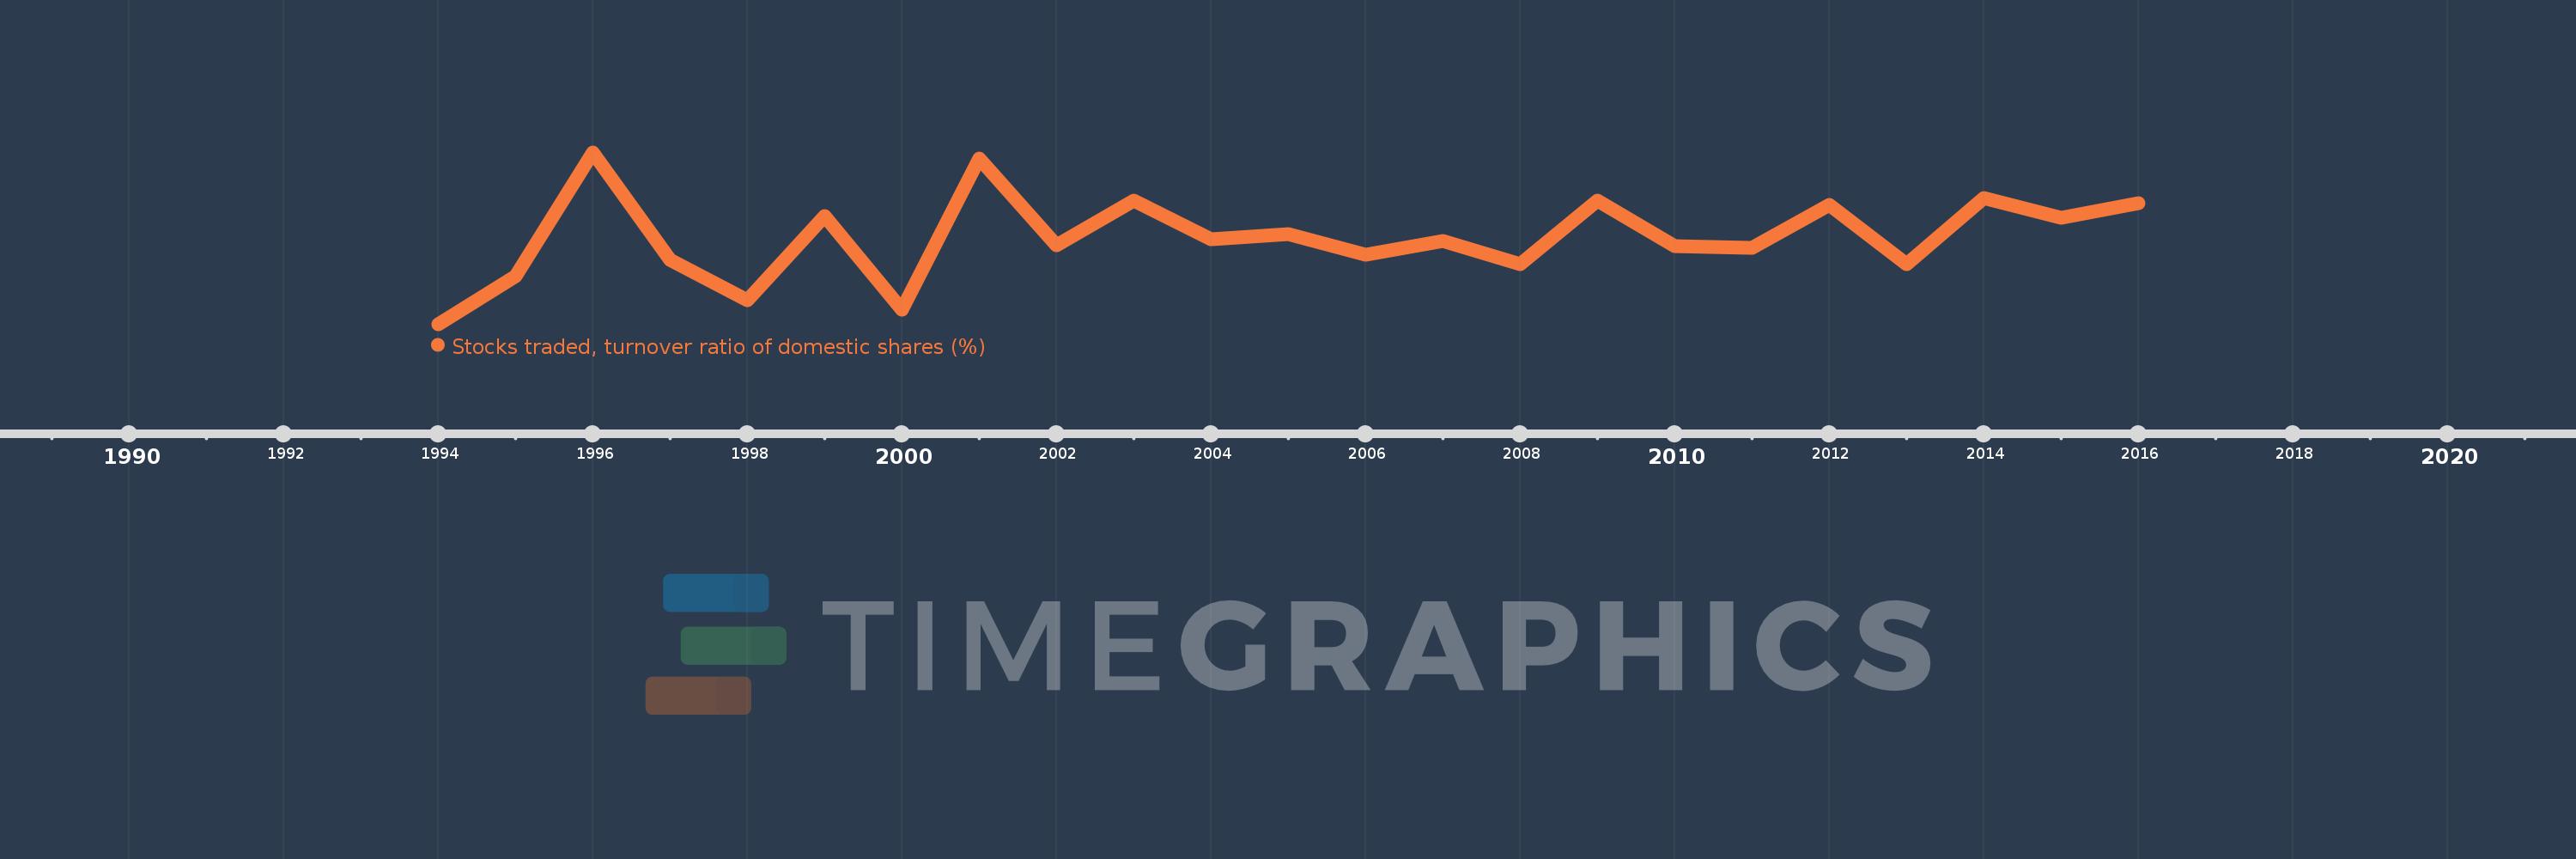
Diese Zeitleiste vorliegt die Graphik ab 1994 J. bis 2016 J. Turkey. Die Angaben bis 1993 J. sind nicht vorhanden. Die Zahl aktueller Beobachtungen nach Daten: 23.

Die Quelle (Bezeichnung):

Kennzahlen der Weltentwicklung

Die Quelle (Einrichtung):

World Federation of Exchanges database.

Kategorien:

Financial Sector

Es wurde aktualisiert:

23 Apr 2017 Jahr

Kennzahlen der Wertänderungen vom Jahr zum Jahr

im Durchschnitt:
145.355
Minimum:
43.698
1 Jan 1994 Jahr
Maximum:
244.99
1 Jan 1996 Jahr
Zum Datum der Beobachtung
Wert
Absolute Veränderung
Die Veränderung bezüglich dem vorherigen Wert
1 Jan 1994 Jahr
43.698
+43.698
0.0%
1 Jan 1995 Jahr
100.287
+56.588
129.5%
1 Jan 1996 Jahr
244.99
+144.704
144.29%
1 Jan 1997 Jahr
119.534
-125.457
-51.21%
1 Jan 1998 Jahr
71.507
-48.027
-40.18%
1 Jan 1999 Jahr
169.919
+98.412
137.63%
1 Jan 2000 Jahr
60.319
-109.6
-64.5%
1 Jan 2001 Jahr
238.08
+177.761
294.7%
1 Jan 2002 Jahr
135.736
-102.345
-42.99%
1 Jan 2003 Jahr
188.579
+52.843
38.93%
1 Jan 2004 Jahr
143.506
-45.073
-23.9%
1 Jan 2005 Jahr
149.099
+5.594
3.9%
1 Jan 2006 Jahr
124.832
-24.268
-16.28%
1 Jan 2007 Jahr
140.774
+15.942
12.77%
1 Jan 2008 Jahr
114.153
-26.62
-18.91%
1 Jan 2009 Jahr
188.151
+73.997
64.82%
1 Jan 2010 Jahr
134.981
-53.169
-28.26%
1 Jan 2011 Jahr
133.33
-1.651
-1.22%
1 Jan 2012 Jahr
183.218
+49.888
37.42%
1 Jan 2013 Jahr
113.873
-69.345
-37.85%
1 Jan 2014 Jahr
191.193
+77.319
67.9%
1 Jan 2015 Jahr
168.248
-22.945
-12.0%
1 Jan 2016 Jahr
185.154
+16.906
10.05%

Bewertung der Länder gemäß mit laufender Statistik nach Jahren