33
/de/
AIzaSyAYiBZKx7MnpbEhh9jyipgxe19OcubqV5w
August 1, 2025
267903
Tunisia
TUN
true
2
1
Expenditure on tertiary as % of government expenditure on education (%)
2013,2011,2010,2009,2008,2007,2006,2005,2004,2003,2002,2001,2000
Download
Bibliothek der Globalstatistik →Tunisia →

Expenditure on tertiary as % of government expenditure on education (%)

Diese Statistik in anderen Ländern:

AlbaniaAlgeriaAmerican SamoaAndorraAngolaAntigua and BarbudaArgentinaArmeniaArubaAustraliaAustriaAzerbaijanBangladeshBarbadosBelarusBelgiumBelizeBeninBermudaBhutanBoliviaBotswanaBrazilBritish Virgin IslandsBrunei DarussalamBulgariaBurkina FasoBurundiCabo VerdeCambodiaCameroonCanadaCaribbean small statesCentral African RepublicCentral Europe and the BalticsChadChileChinaColombiaComorosCongo, Dem. Rep.Congo, Rep.Costa RicaCote d'IvoireCroatiaCubaCuracaoCyprusCzech RepublicDenmarkDjiboutiDominican RepublicEast Asia & PacificEast Asia & Pacific (excluding high income)East Asia & Pacific (IDA & IBRD countries)EcuadorEl SalvadorEquatorial GuineaEritreaEstoniaEthiopiaEuro areaEurope & Central AsiaEurope & Central Asia (excluding high income)Europe & Central Asia (IDA & IBRD countries)European UnionFijiFinlandFranceGabonGambia, TheGeorgiaGermanyGhanaGreeceGrenadaGuatemalaGuineaGuinea-BissauGuyanaHeavily indebted poor countries (HIPC)High incomeHondurasHong Kong SAR, ChinaHungaryIBRD onlyIcelandIDA & IBRD totalIDA blendIDA onlyIDA totalIndiaIndonesiaIran, Islamic Rep.IrelandIsraelItalyJamaicaJapanJordanKazakhstanKenyaKorea, Rep.KuwaitKyrgyz RepublicLao PDRLate-demographic dividendLatin America & Caribbean Latin America & Caribbean (excluding high income)Latin America & the Caribbean (IDA & IBRD countries)LatviaLeast developed countries: UN classificationLebanonLesothoLiberiaLibyaLiechtensteinLithuaniaLow & middle incomeLow incomeLower middle incomeMacao SAR, ChinaMacedonia, FYRMadagascarMalawiMalaysiaMaldivesMaliMaltaMarshall IslandsMauritaniaMauritiusMexicoMiddle incomeMoldovaMonacoMongoliaMoroccoMozambiqueNamibiaNepalNetherlandsNew ZealandNicaraguaNigerNorth AmericaNorwayOECD membersOmanOther small statesPakistanPalauPanamaParaguayPeruPhilippinesPolandPortugalPost-demographic dividendPre-demographic dividendPuerto RicoRomaniaRussian FederationRwandaSamoaSan MarinoSao Tome and PrincipeSaudi ArabiaSenegalSerbiaSeychellesSierra LeoneSingaporeSlovak RepublicSloveniaSmall statesSouth AfricaSouth AsiaSouth Asia (IDA & IBRD)South SudanSpainSri LankaSt. Kitts and NevisSt. LuciaSt. Vincent and the GrenadinesSub-Saharan Africa Sub-Saharan Africa (excluding high income)Sub-Saharan Africa (IDA & IBRD countries)SwazilandSwedenSwitzerlandSyrian Arab RepublicTajikistanTanzaniaThailandTimor-LesteTogoTongaTunisiaTurkeyTurkmenistanTurks and Caicos IslandsUgandaUkraineUnited KingdomUnited StatesUpper middle incomeUruguayVanuatuVenezuela, RBVietnamWorldZambiaZimbabwe

Zeitlinie:

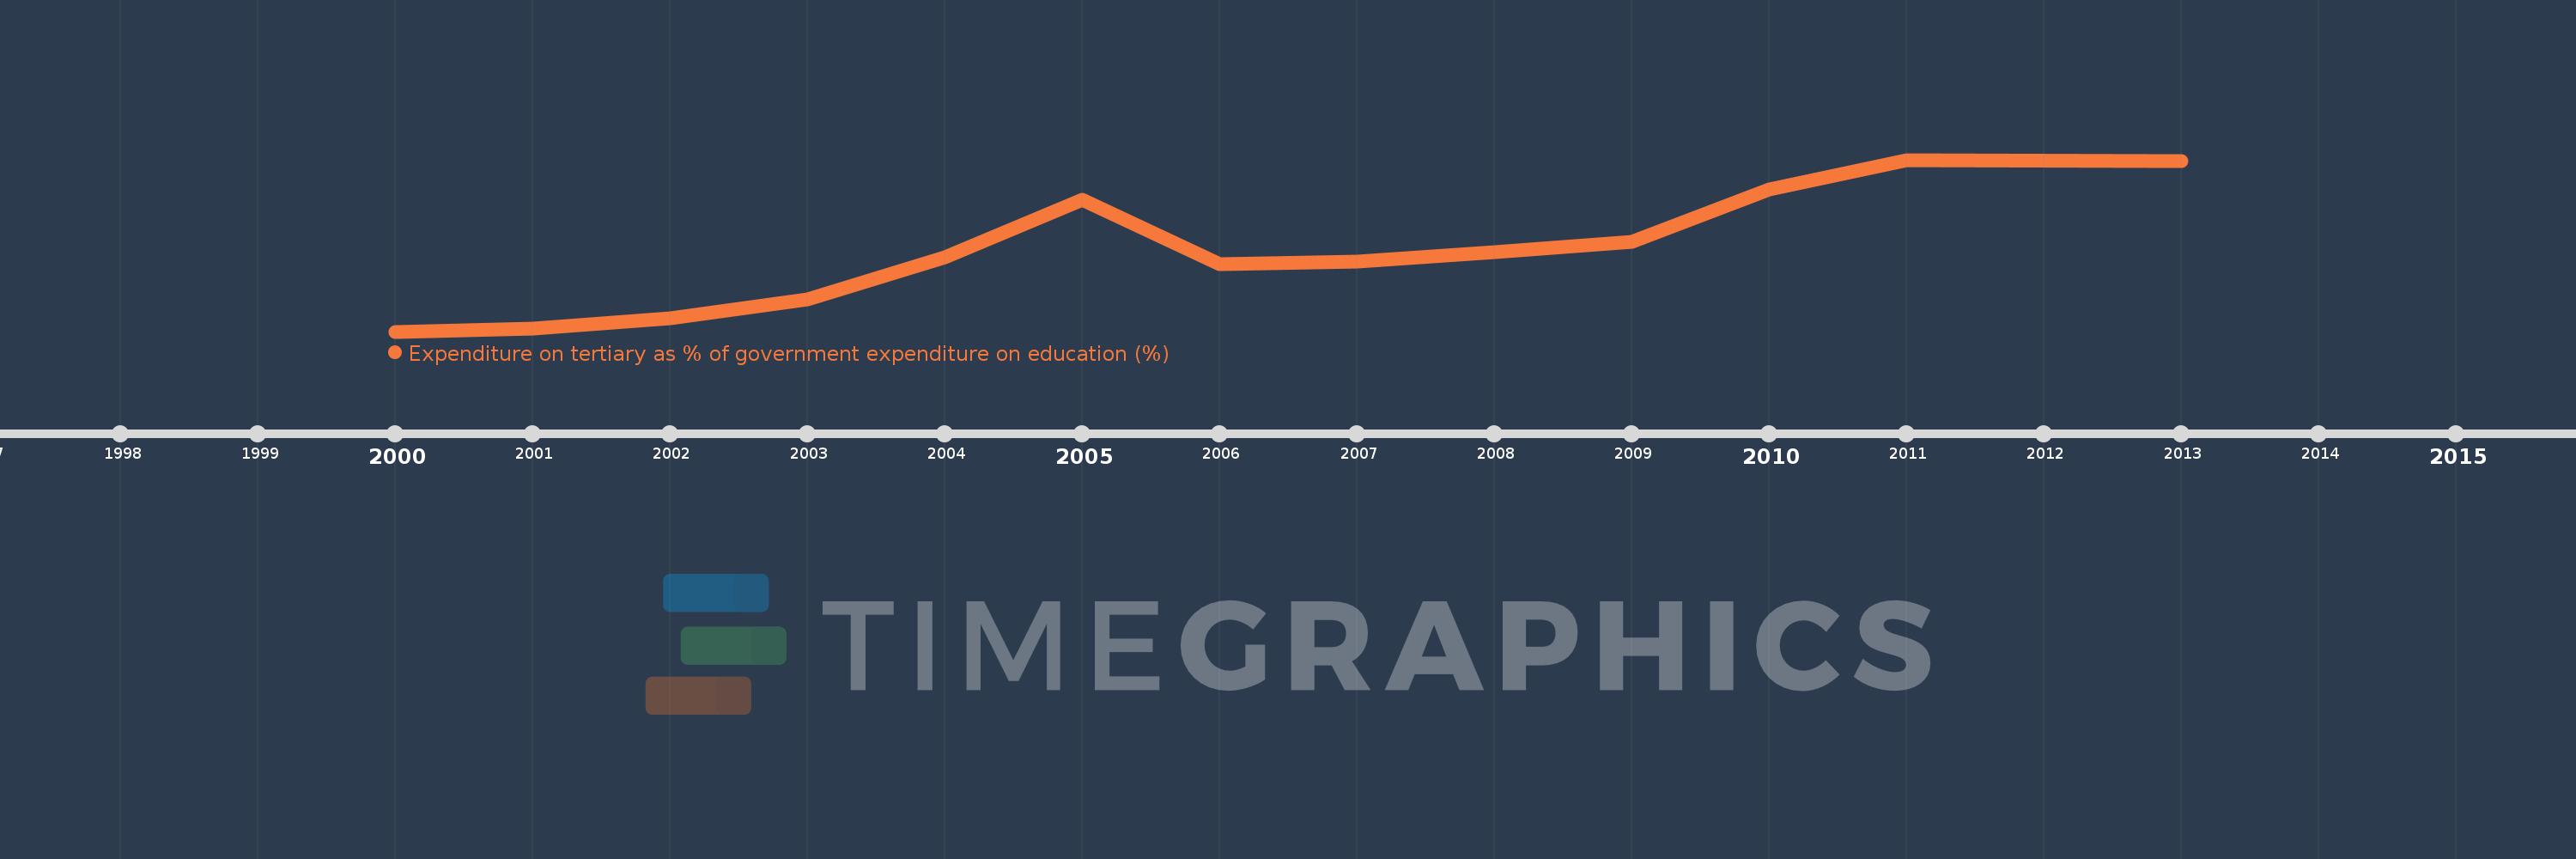
Diese Zeitleiste vorliegt die Graphik ab 2000 J. bis 2013 J. Tunisia. Die Angaben bis 1999 J. sind nicht vorhanden. Die Zahl aktueller Beobachtungen nach Daten: 13.

Die Quelle (Bezeichnung):

Kennzahlen der Weltentwicklung

Die Quelle (Einrichtung):

UNESCO Institute for Statistics

Kategorien:

Education

Es wurde aktualisiert:

23 Apr 2017 Jahr

Kennzahlen der Wertänderungen vom Jahr zum Jahr

im Durchschnitt:
24.644
Minimum:
21.533
1 Jan 2000 Jahr
Maximum:
28.173
1 Jan 2011 Jahr
Zum Datum der Beobachtung
Wert
Absolute Veränderung
Die Veränderung bezüglich dem vorherigen Wert
1 Jan 2000 Jahr
21.533
+21.533
0.0%
1 Jan 2001 Jahr
21.655
+0.122
0.57%
1 Jan 2002 Jahr
22.051
+0.396
1.83%
1 Jan 2003 Jahr
22.782
+0.731
3.31%
1 Jan 2004 Jahr
24.414
+1.632
7.16%
1 Jan 2005 Jahr
26.632
+2.218
9.09%
1 Jan 2006 Jahr
24.139
-2.493
-9.36%
1 Jan 2007 Jahr
24.255
+0.115
0.48%
1 Jan 2008 Jahr
24.591
+0.337
1.39%
1 Jan 2009 Jahr
24.999
+0.408
1.66%
1 Jan 2010 Jahr
27.025
+2.025
8.1%
1 Jan 2011 Jahr
28.173
+1.149
4.25%
1 Jan 2013 Jahr
28.127
-0.046
-0.16%

Bewertung der Länder gemäß mit laufender Statistik nach Jahren