33
/de/
AIzaSyB4mHJ5NPEv-XzF7P6NDYXjlkCWaeKw5bc
November 30, 2025
267265
Trinidad and Tobago
TTO
true
2
1
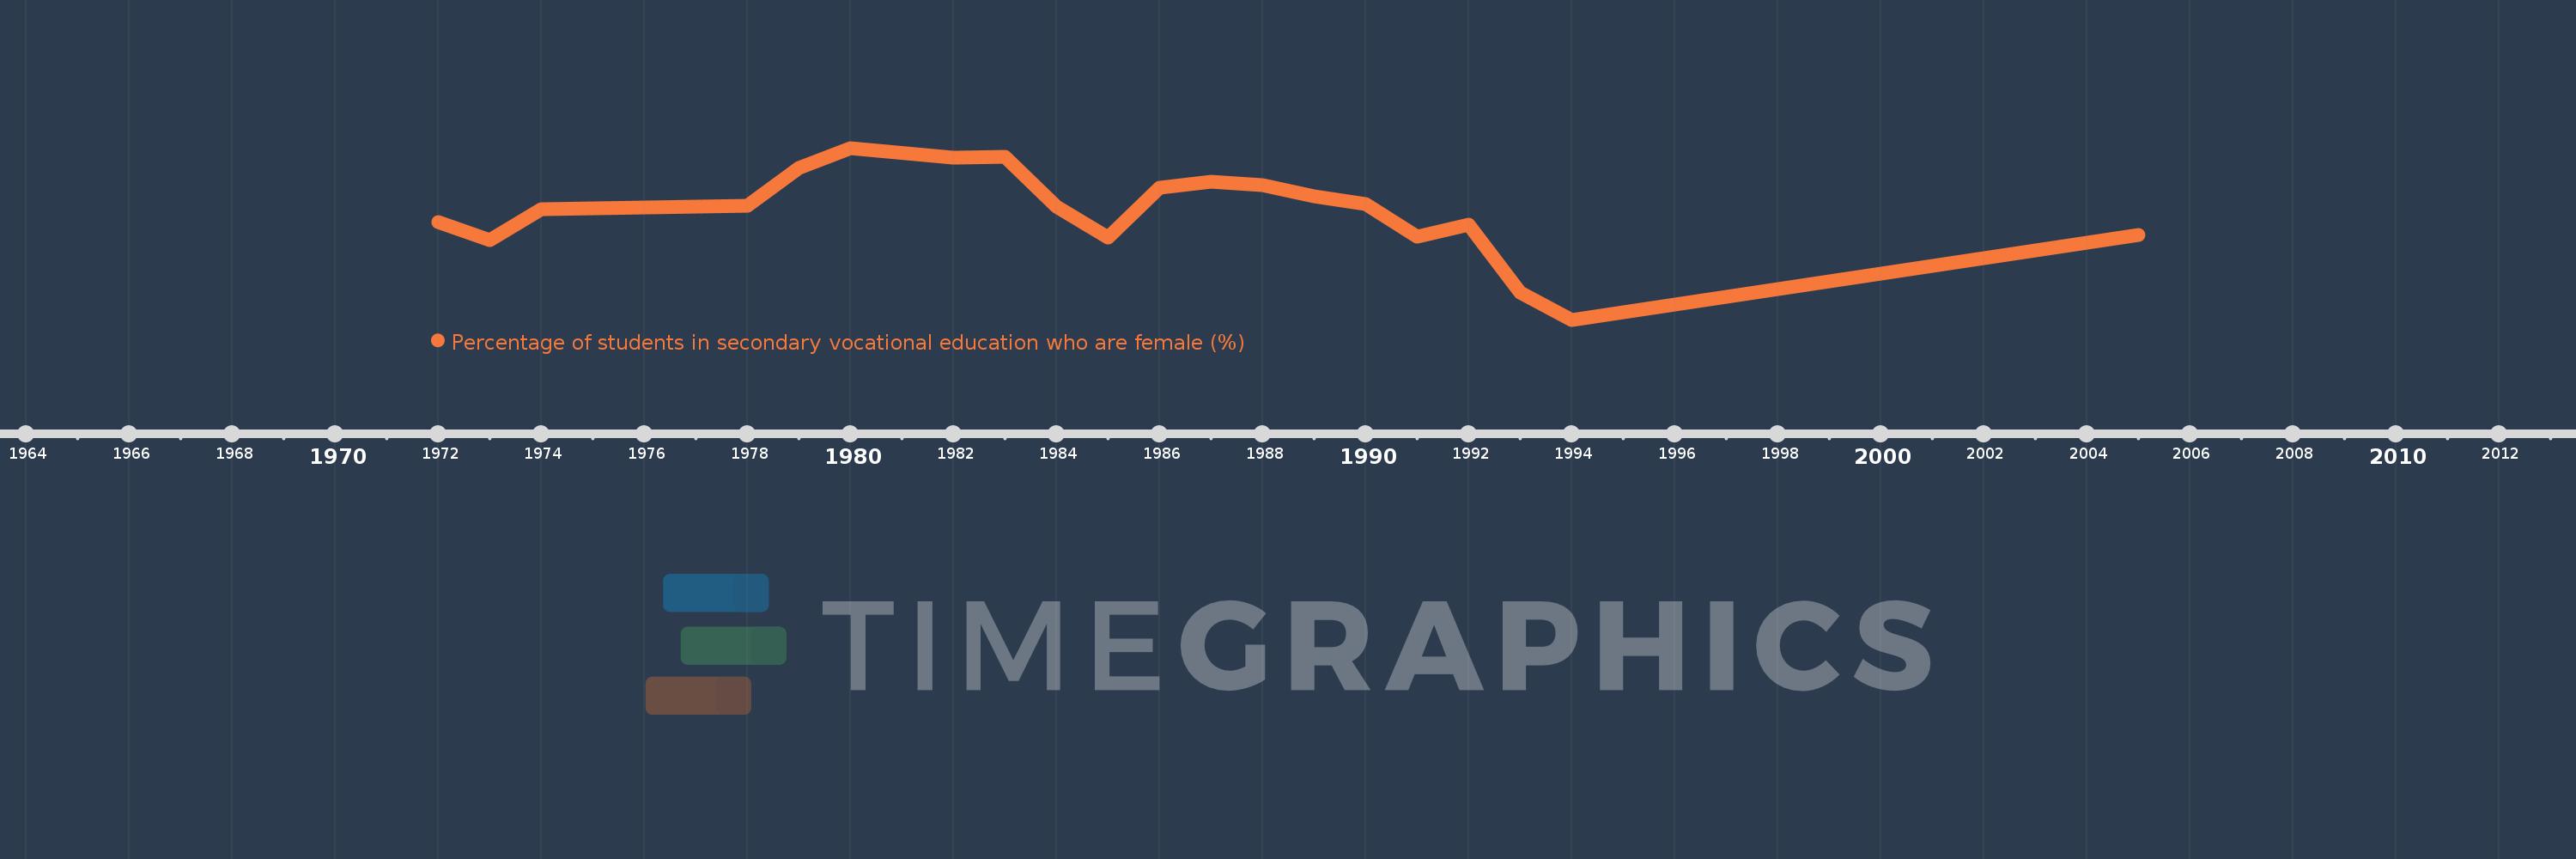
Percentage of students in secondary vocational education who are female (%)
2005,1994,1993,1992,1991,1990,1989,1988,1987,1986,1985,1984,1983,1982,1980,1979,1978,1974,1973,1972