33
/de/
AIzaSyB4mHJ5NPEv-XzF7P6NDYXjlkCWaeKw5bc
November 1, 2025
267263
Trinidad and Tobago
TTO
true
2
1
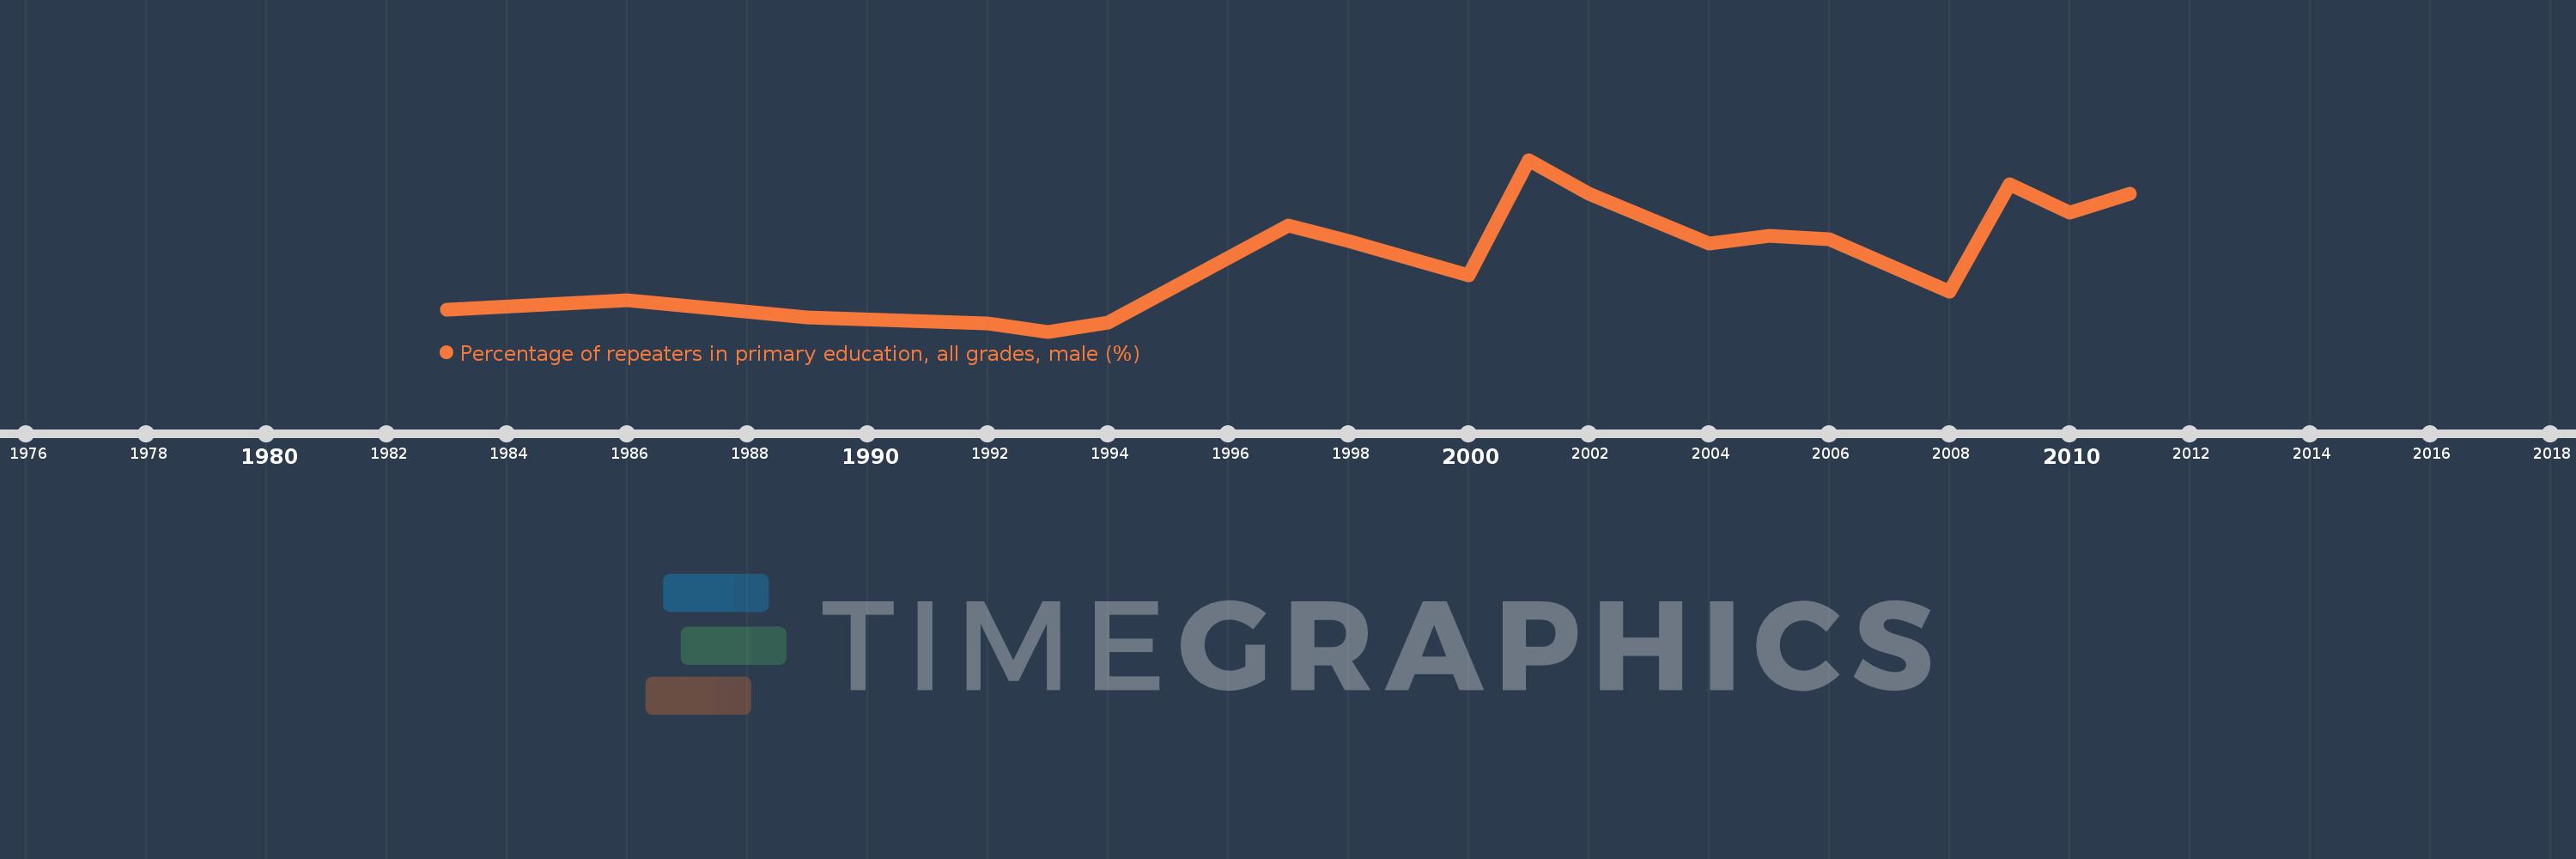
Percentage of repeaters in primary education, all grades, male (%)
2011,2010,2009,2008,2006,2005,2004,2002,2001,2000,1998,1997,1994,1993,1992,1989,1986,1983