29
/de/
de
AIzaSyAYiBZKx7MnpbEhh9jyipgxe19OcubqV5w
April 1, 2024
265537
Tonga
TON
true
2
1
Broad money (% of GDP)
2016,2015,2014,2013,2012,2011,2010,2009,2008,2007,2006,2005,2004,2003,2002,2001,2000,1999,1998,1997,1996,1995,1994,1993,1992,1991,1990
Download
Bibliothek der Globalstatistik →Tonga →

Broad money (% of GDP)

Diese Statistik in anderen Ländern:
AfghanistanAlbaniaAlgeriaAngolaAntigua and BarbudaArab WorldArgentinaArmeniaArubaAustraliaAzerbaijanBahamas, TheBahrainBangladeshBarbadosBelarusBelizeBeninBhutanBoliviaBosnia and HerzegovinaBotswanaBrazilBrunei DarussalamBulgariaBurkina FasoBurundiCabo VerdeCambodiaCameroonCanadaCaribbean small statesCentral African RepublicCentral Europe and the BalticsChadChileChinaColombiaComorosCongo, Dem. Rep.Congo, Rep.Costa RicaCote d'IvoireCroatiaCzech RepublicDenmarkDjiboutiDominicaDominican RepublicEarly-demographic dividendEast Asia & PacificEast Asia & Pacific (excluding high income)East Asia & Pacific (IDA & IBRD countries)EcuadorEgypt, Arab Rep.El SalvadorEquatorial GuineaEritreaEstoniaEthiopiaEurope & Central Asia (excluding high income)Europe & Central Asia (IDA & IBRD countries)FijiFragile and conflict affected situationsGabonGambia, TheGeorgiaGhanaGrenadaGuatemalaGuineaGuinea-BissauGuyanaHaitiHeavily indebted poor countries (HIPC)High incomeHondurasHong Kong SAR, ChinaHungaryIBRD onlyIcelandIDA & IBRD totalIDA blendIDA onlyIDA totalIndiaIndonesiaIran, Islamic Rep.IraqIsraelJamaicaJapanJordanKazakhstanKenyaKorea, Rep.KuwaitKyrgyz RepublicLao PDRLate-demographic dividendLatin America & Caribbean Latin America & Caribbean (excluding high income)Latin America & the Caribbean (IDA & IBRD countries)LatviaLeast developed countries: UN classificationLebanonLesothoLiberiaLibyaLithuaniaLow & middle incomeLow incomeLower middle incomeMacao SAR, ChinaMacedonia, FYRMadagascarMalawiMalaysiaMaldivesMaliMauritaniaMauritiusMexicoMicronesia, Fed. Sts.Middle East & North AfricaMiddle East & North Africa (excluding high income)Middle East & North Africa (IDA & IBRD countries)Middle incomeMoldovaMongoliaMoroccoMozambiqueMyanmarNamibiaNepalNew ZealandNicaraguaNigerNigeriaNorth AmericaNorwayOECD membersOmanOther small statesPacific island small statesPakistanPanamaPapua New GuineaParaguayPeruPhilippinesPolandPost-demographic dividendPre-demographic dividendQatarRomaniaRussian FederationRwandaSamoaSao Tome and PrincipeSaudi ArabiaSenegalSerbiaSeychellesSierra LeoneSingaporeSlovak RepublicSmall statesSolomon IslandsSouth AfricaSouth AsiaSouth Asia (IDA & IBRD)South SudanSri LankaSt. Kitts and NevisSt. LuciaSt. Vincent and the GrenadinesSub-Saharan Africa Sub-Saharan Africa (excluding high income)Sub-Saharan Africa (IDA & IBRD countries)SudanSurinameSwazilandSwedenSwitzerlandSyrian Arab RepublicTajikistanTanzaniaThailandTimor-LesteTogoTongaTrinidad and TobagoTunisiaTurkeyUgandaUkraineUnited Arab EmiratesUnited KingdomUnited StatesUpper middle incomeUruguayVanuatuVenezuela, RBVietnamWest Bank and GazaWorldYemen, Rep.ZambiaZimbabwe
Zeitlinie:
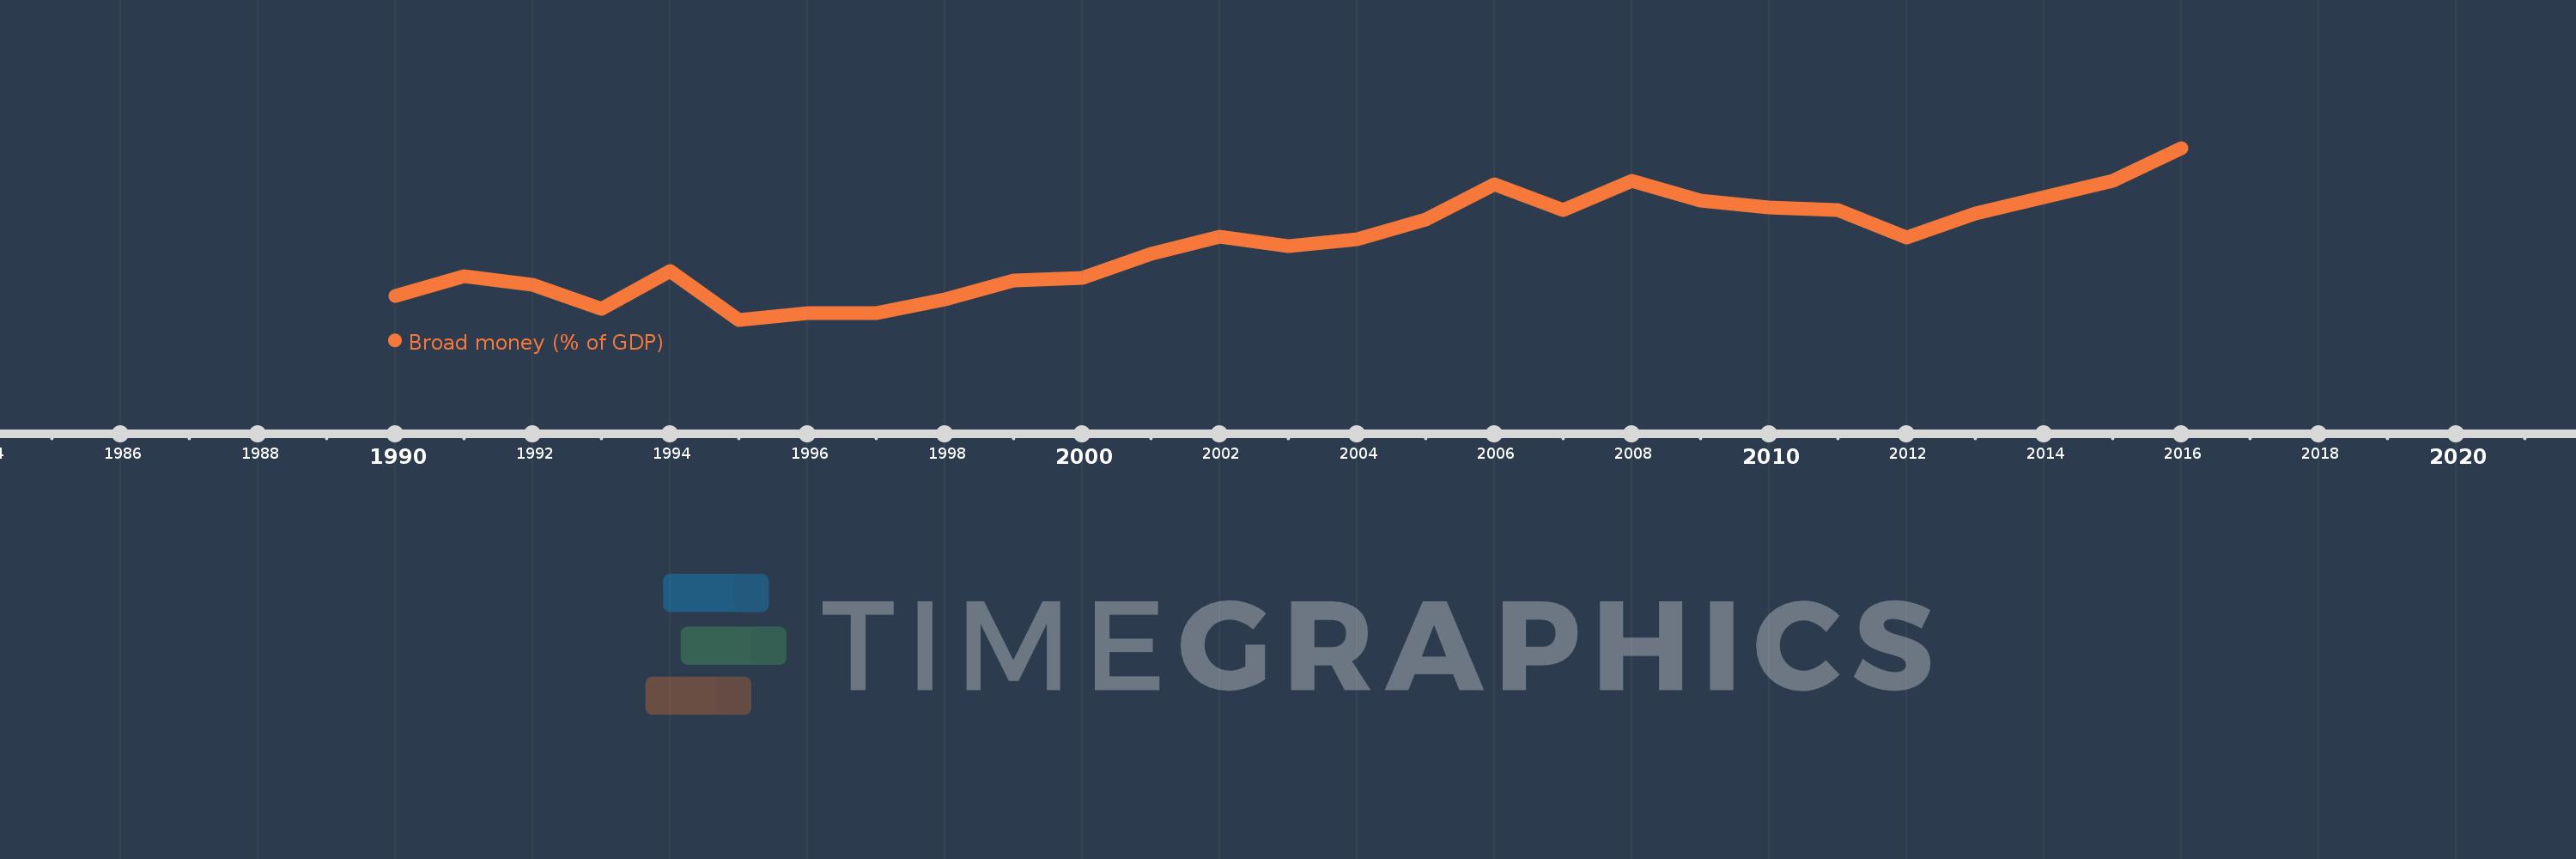
Diese Zeitleiste vorliegt die Graphik ab 1990 J. bis 2016 J. Tonga. Die Angaben bis 1989 J. sind nicht vorhanden. Die Zahl aktueller Beobachtungen nach Daten: 27.
Die Quelle (Bezeichnung):
Kennzahlen der Weltentwicklung
Die Quelle (Einrichtung):
International Monetary Fund, International Financial Statistics and data files, and World Bank and OECD GDP estimates.
Kategorien:
Financial Sector
Es wurde aktualisiert:
23 Apr 2017 Jahr
Kennzahlen der Wertänderungen vom Jahr zum Jahr
im Durchschnitt:
38.338
Minimum:
26.79
1 Jan 1995 Jahr
Maximum:
53.209
1 Jan 2016 Jahr
Zum Datum der Beobachtung
Wert
Absolute Veränderung
Die Veränderung bezüglich dem vorherigen Wert
1 Jan 1990 Jahr
30.482
+30.482
0.0%
1 Jan 1991 Jahr
33.46
+2.977
9.77%
1 Jan 1992 Jahr
32.199
-1.261
-3.77%
1 Jan 1993 Jahr
28.479
-3.72
-11.55%
1 Jan 1994 Jahr
34.222
+5.742
20.16%
1 Jan 1995 Jahr
26.79
-7.431
-21.72%
1 Jan 1996 Jahr
27.803
+1.013
3.78%
1 Jan 1997 Jahr
27.764
-0.039
-0.14%
1 Jan 1998 Jahr
29.982
+2.218
7.99%
1 Jan 1999 Jahr
32.781
+2.799
9.34%
1 Jan 2000 Jahr
33.216
+0.435
1.33%
1 Jan 2001 Jahr
36.969
+3.753
11.3%
1 Jan 2002 Jahr
39.55
+2.581
6.98%
1 Jan 2003 Jahr
38.156
-1.394
-3.52%
1 Jan 2004 Jahr
39.127
+0.97
2.54%
1 Jan 2005 Jahr
42.23
+3.104
7.93%
1 Jan 2006 Jahr
47.625
+5.395
12.77%
1 Jan 2007 Jahr
43.724
-3.901
-8.19%
1 Jan 2008 Jahr
48.154
+4.43
10.13%
1 Jan 2009 Jahr
45.087
-3.068
-6.37%
1 Jan 2010 Jahr
44.049
-1.038
-2.3%
1 Jan 2011 Jahr
43.62
-0.429
-0.97%
1 Jan 2012 Jahr
39.489
-4.131
-9.47%
1 Jan 2013 Jahr
43.089
+3.6
9.12%
1 Jan 2014 Jahr
45.669
+2.58
5.99%
1 Jan 2015 Jahr
48.192
+2.523
5.52%
1 Jan 2016 Jahr
53.209
+5.017
10.41%
Bewertung der Länder gemäß mit laufender Statistik nach Jahren

Kommentare:

Abschicken
PremiumAbout & FeedbackVereinbarungPrivatheit
logo
© 2022 Selected Technologies LLC – Morgan Hill, California