33
/de/
AIzaSyAYiBZKx7MnpbEhh9jyipgxe19OcubqV5w
August 1, 2025
25996
Central Europe and the Baltics
CEB
false
2
1
New business density (new registrations per 1,000 people ages 15-64)
2015,2013,2012,2011,2010,2009,2008,2007,2006,2005
Download
Bibliothek der Globalstatistik →Central Europe and the Baltics →

New business density (new registrations per 1,000 people ages 15-64)

Diese Statistik in anderen Ländern:

AfghanistanAlbaniaAlgeriaAntigua and BarbudaArab WorldArgentinaArmeniaAustraliaAustriaAzerbaijanBangladeshBelarusBelgiumBelizeBhutanBoliviaBosnia and HerzegovinaBotswanaBrazilBritish Virgin IslandsBulgariaBurkina FasoCambodiaCanadaCaribbean small statesCentral Europe and the BalticsChileColombiaCongo, Dem. Rep.Costa RicaCroatiaCyprusCzech RepublicDenmarkDominicaDominican RepublicEarly-demographic dividendEast Asia & PacificEast Asia & Pacific (excluding high income)East Asia & Pacific (IDA & IBRD countries)Egypt, Arab Rep.El SalvadorEstoniaEthiopiaEuro areaEurope & Central AsiaEurope & Central Asia (excluding high income)Europe & Central Asia (IDA & IBRD countries)European UnionFinlandFragile and conflict affected situationsFranceGabonGeorgiaGermanyGhanaGreeceGrenadaGuatemalaGuineaHaitiHeavily indebted poor countries (HIPC)High incomeHong Kong SAR, ChinaHungaryIBRD onlyIcelandIDA & IBRD totalIDA blendIDA onlyIDA totalIndiaIndonesiaIraqIrelandIsle of ManIsraelItalyJamaicaJapanJordanKazakhstanKenyaKiribatiKorea, Rep.KosovoKyrgyz RepublicLao PDRLate-demographic dividendLatin America & Caribbean Latin America & Caribbean (excluding high income)Latin America & the Caribbean (IDA & IBRD countries)LatviaLeast developed countries: UN classificationLesothoLiechtensteinLithuaniaLow & middle incomeLow incomeLower middle incomeLuxembourgMacedonia, FYRMadagascarMalawiMalaysiaMaldivesMaltaMauritiusMexicoMiddle East & North AfricaMiddle East & North Africa (excluding high income)Middle East & North Africa (IDA & IBRD countries)Middle incomeMoldovaMongoliaMontenegroMoroccoNamibiaNepalNetherlandsNew ZealandNigerNigeriaNorth AmericaNorwayOECD membersOmanOther small statesPacific island small statesPakistanPanamaPeruPhilippinesPolandPortugalPost-demographic dividendPre-demographic dividendQatarRomaniaRussian FederationRwandaSamoaSao Tome and PrincipeSenegalSerbiaSierra LeoneSingaporeSlovak RepublicSloveniaSmall statesSouth AfricaSouth AsiaSouth Asia (IDA & IBRD)South SudanSpainSri LankaSt. Kitts and NevisSt. LuciaSt. Vincent and the GrenadinesSub-Saharan Africa Sub-Saharan Africa (excluding high income)Sub-Saharan Africa (IDA & IBRD countries)SurinameSwedenSwitzerlandSyrian Arab RepublicTajikistanThailandTimor-LesteTogoTongaTunisiaTurkeyUgandaUkraineUnited Arab EmiratesUnited KingdomUpper middle incomeUruguayUzbekistanVanuatuWorldZambia

Zeitlinie:

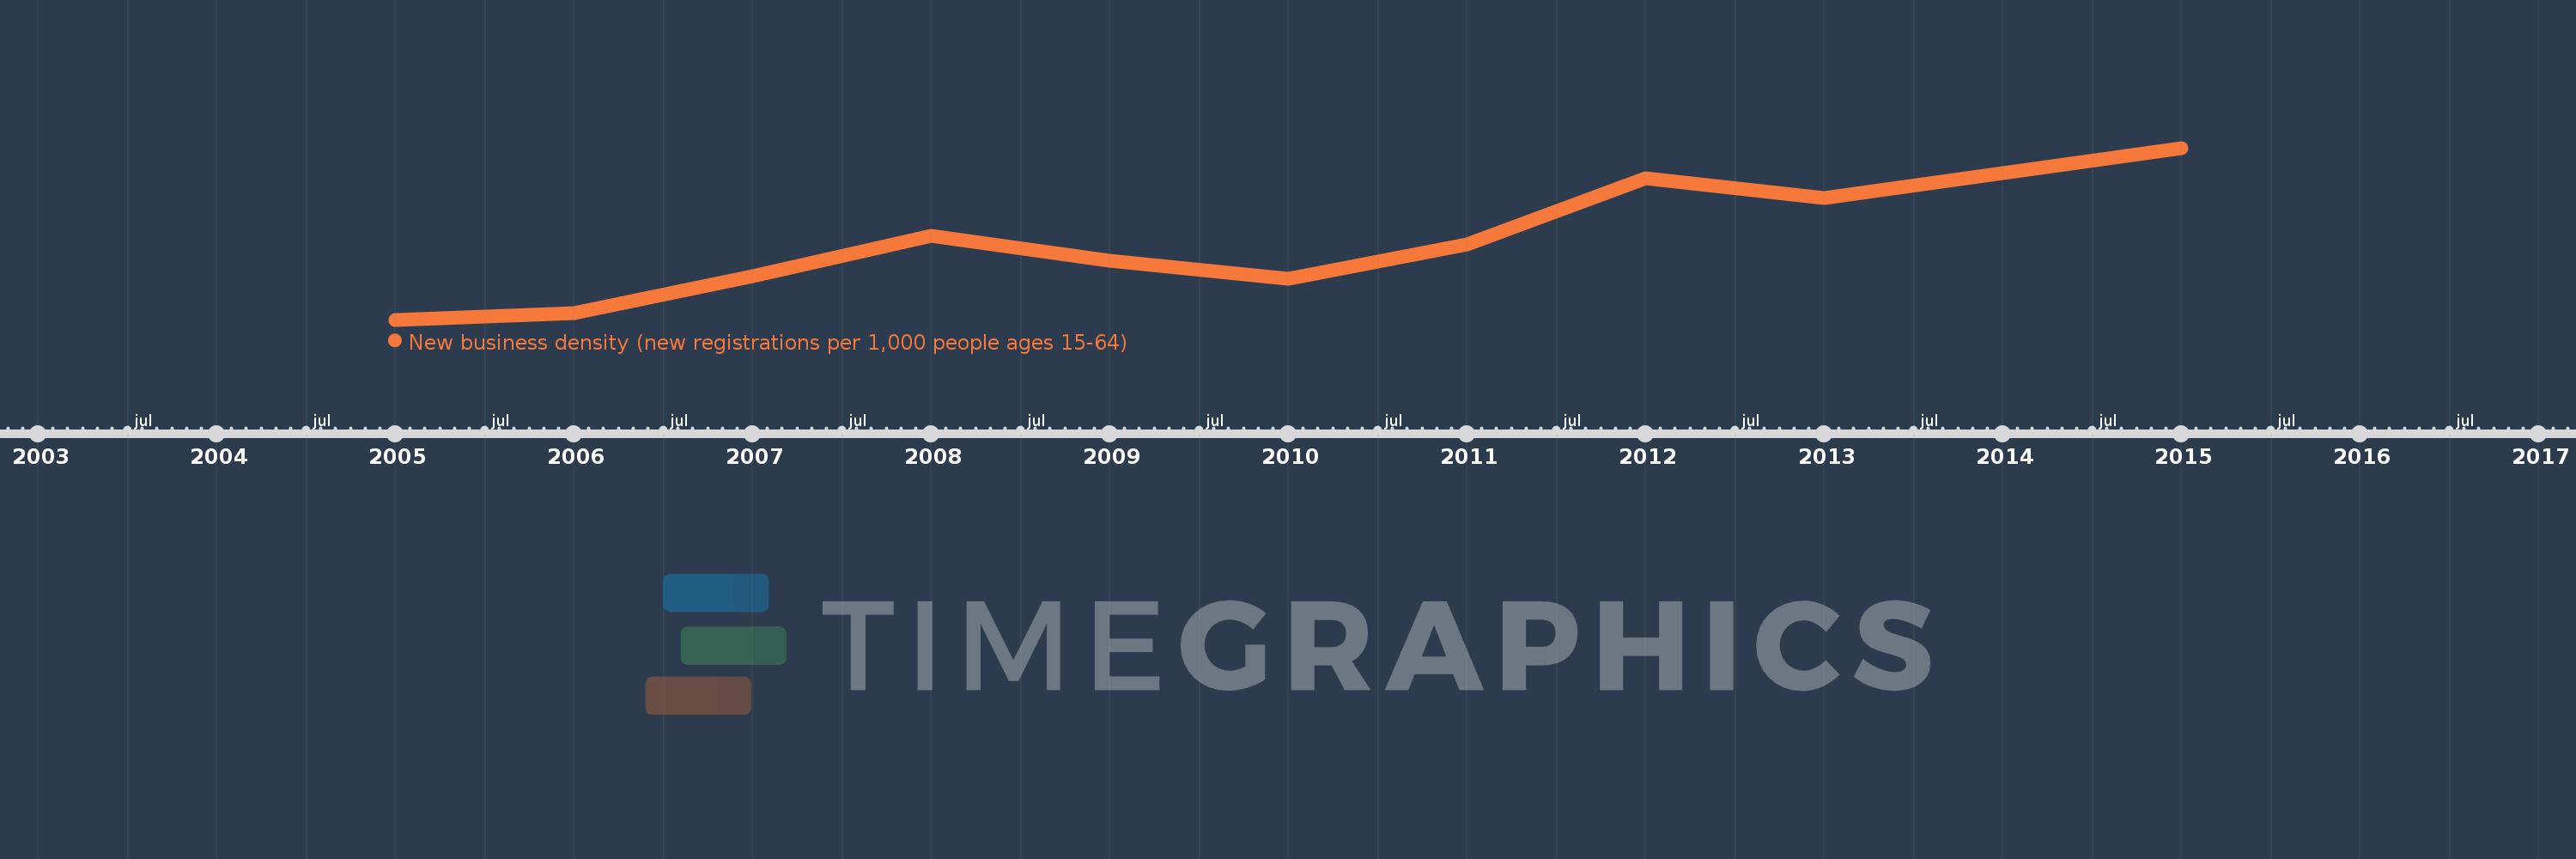
Diese Zeitleiste vorliegt die Graphik ab 2005 J. bis 2015 J. Central Europe and the Baltics. Die Angaben bis 2004 J. sind nicht vorhanden. Die Zahl aktueller Beobachtungen nach Daten: 10.

Die Quelle (Bezeichnung):

Kennzahlen der Weltentwicklung

Die Quelle (Einrichtung):

World Bank's Entrepreneurship Survey and database (http://econ.worldbank.org/research/entrepreneurship).

Kategorien:

Private Sector

Es wurde aktualisiert:

23 Apr 2017 Jahr

Kennzahlen der Wertänderungen vom Jahr zum Jahr

im Durchschnitt:
4.732
Minimum:
3.529
1 Jan 2005 Jahr
Maximum:
6.303
1 Jan 2015 Jahr
Zum Datum der Beobachtung
Wert
Absolute Veränderung
Die Veränderung bezüglich dem vorherigen Wert
1 Jan 2005 Jahr
3.529
+3.529
0.0%
1 Jan 2006 Jahr
3.637
+0.107
3.04%
1 Jan 2007 Jahr
4.239
+0.602
16.56%
1 Jan 2008 Jahr
4.878
+0.64
15.09%
1 Jan 2009 Jahr
4.487
-0.391
-8.02%
1 Jan 2010 Jahr
4.187
-0.3
-6.69%
1 Jan 2011 Jahr
4.752
+0.565
13.5%
1 Jan 2012 Jahr
5.807
+1.055
22.2%
1 Jan 2013 Jahr
5.5
-0.307
-5.29%
1 Jan 2015 Jahr
6.303
+0.803
14.6%

Bewertung der Länder gemäß mit laufender Statistik nach Jahren