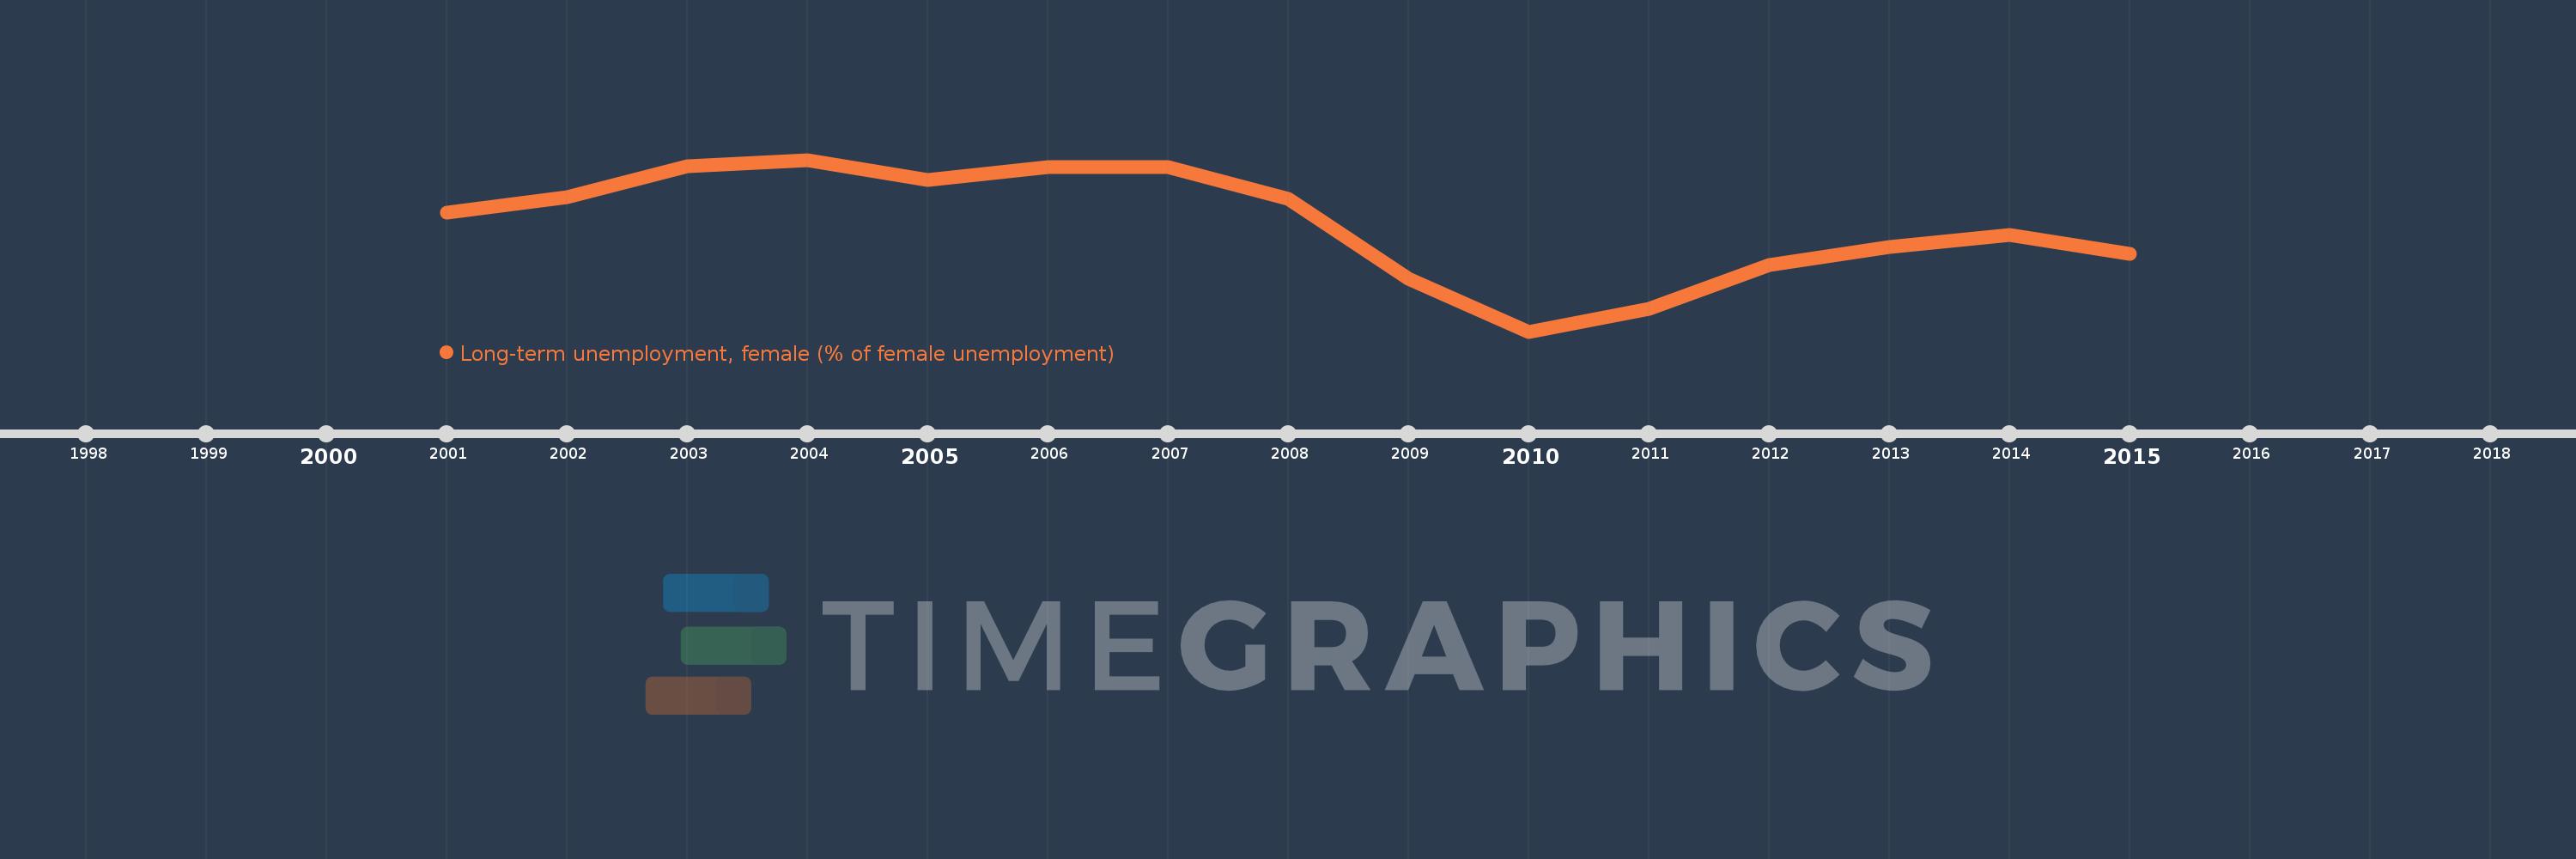
Diese Zeitleiste vorliegt die Graphik ab 2001 J. bis 2015 J. Central Europe and the Baltics. Die Angaben bis 2000 J. sind nicht vorhanden. Die Zahl aktueller Beobachtungen nach Daten: 15.
Die Quelle (Bezeichnung):
Kennzahlen der Weltentwicklung
Die Quelle (Einrichtung):
International Labour Organization, Key Indicators of the Labour Market database.
Kategorien:
Social Protection & Labor, Gender
Es wurde aktualisiert:
23 Apr 2017 Jahr
Kennzahlen der Wertänderungen vom Jahr zum Jahr
im Durchschnitt:
46.787
Minimum:
34.097
1 Jan 2010 Jahr
Maximum:
54.473
1 Jan 2004 Jahr
Zum Datum der Beobachtung
Wert
Absolute Veränderung
Die Veränderung bezüglich dem vorherigen Wert
1 Jan 2001 Jahr
48.254
+48.254
0.0%
1 Jan 2002 Jahr
50.08
+1.826
3.79%
1 Jan 2003 Jahr
53.665
+3.585
7.16%
1 Jan 2004 Jahr
54.473
+0.808
1.51%
1 Jan 2005 Jahr
52.084
-2.389
-4.39%
1 Jan 2006 Jahr
53.585
+1.5
2.88%
1 Jan 2007 Jahr
53.562
-0.023
-0.04%
1 Jan 2008 Jahr
49.798
-3.763
-7.03%
1 Jan 2009 Jahr
40.383
-9.415
-18.91%
1 Jan 2010 Jahr
34.097
-6.286
-15.57%
1 Jan 2011 Jahr
36.754
+2.657
7.79%
1 Jan 2012 Jahr
42.024
+5.27
14.34%
1 Jan 2013 Jahr
44.129
+2.105
5.01%
1 Jan 2014 Jahr
45.55
+1.421
3.22%
1 Jan 2015 Jahr
43.365
-2.185
-4.8%
Bewertung der Länder gemäß mit laufender Statistik nach Jahren