33
/de/
AIzaSyB4mHJ5NPEv-XzF7P6NDYXjlkCWaeKw5bc
November 30, 2025
258511
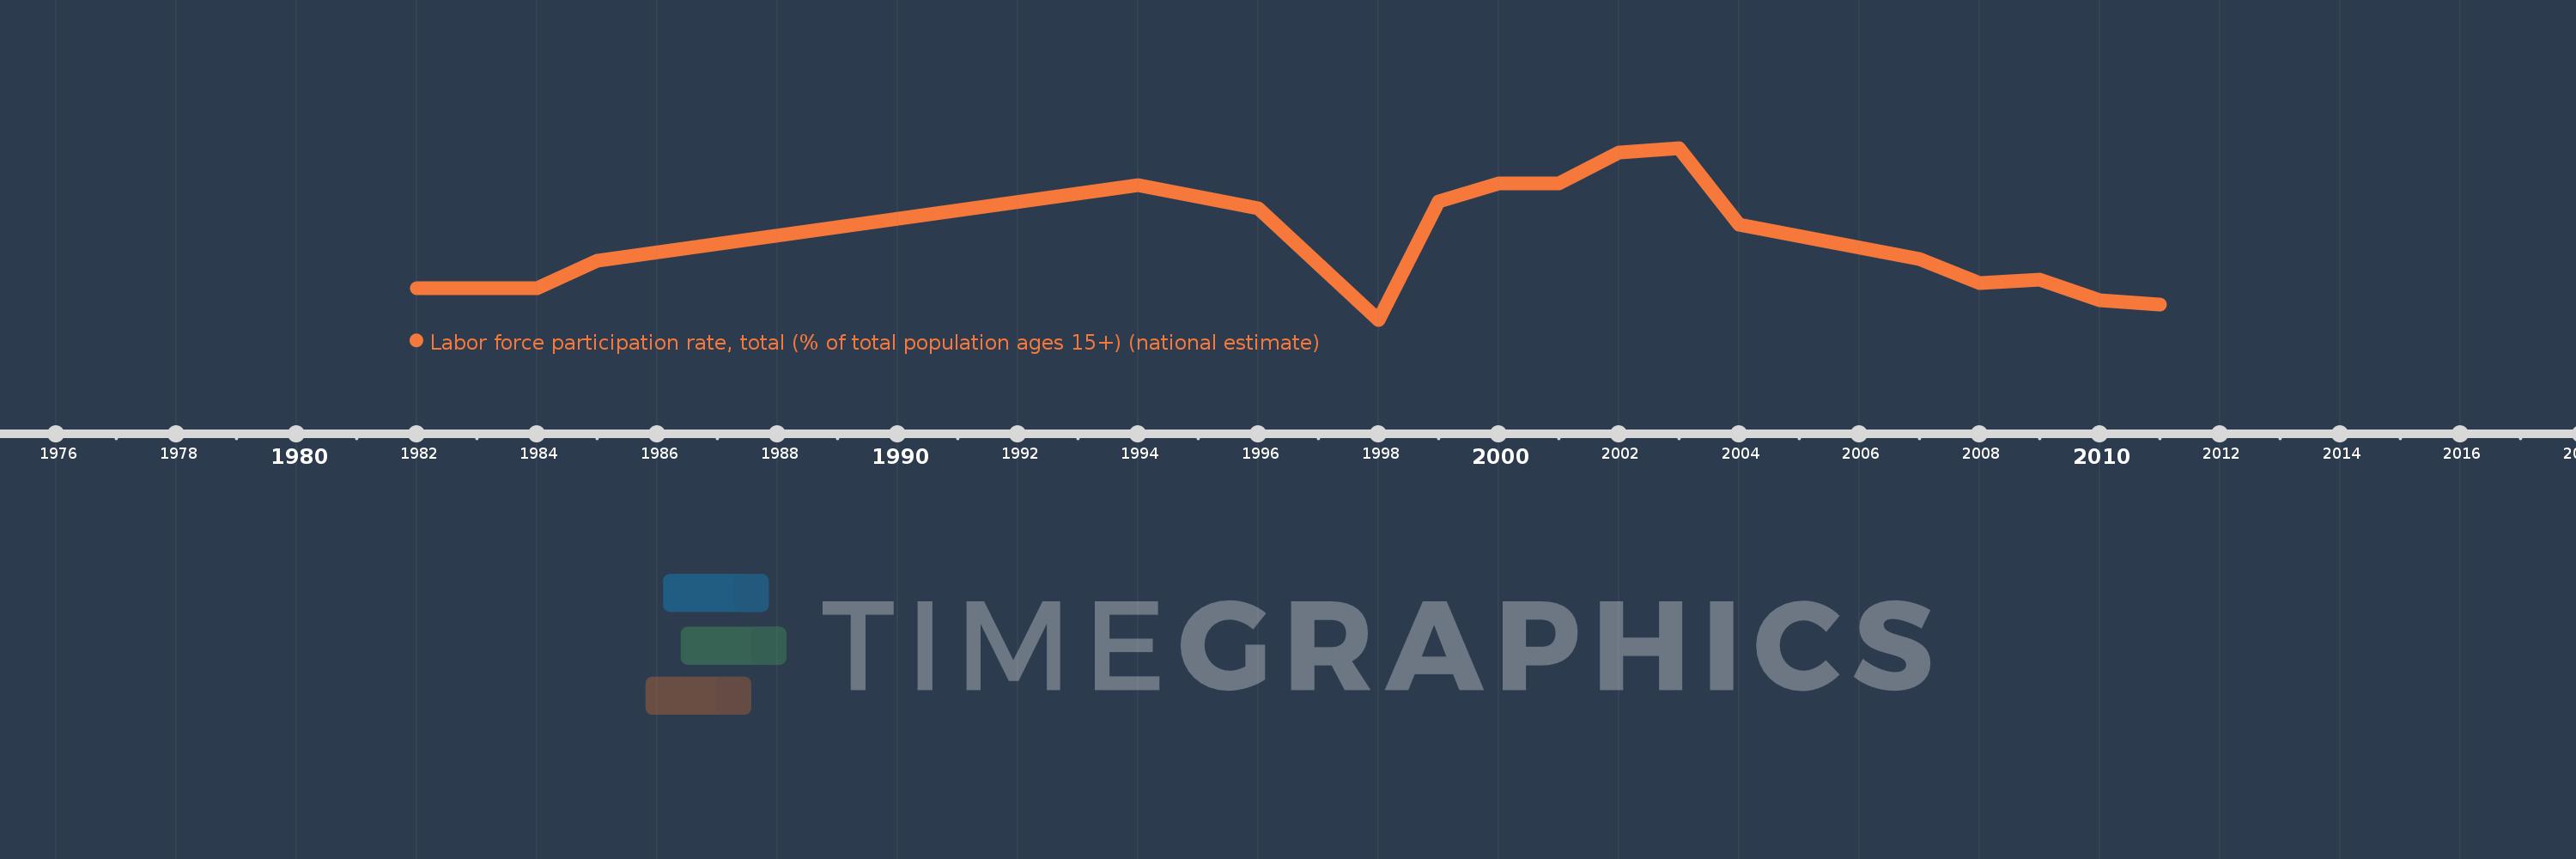
Syrian Arab Republic
SYR
true
2
1
Labor force participation rate, total (% of total population ages 15+) (national estimate)
2011,2010,2009,2008,2007,2004,2003,2002,2001,2000,1999,1998,1996,1994,1985,1984,1982