33
/de/
AIzaSyAYiBZKx7MnpbEhh9jyipgxe19OcubqV5w
August 1, 2025
25708
Central Europe and the Baltics
CEB
false
2
1
GNI (constant 2010 US$)
2016,2015,2014,2013,2012,2011,2010,2009,2008,2007,2006,2005,2004,2003,2002,2001,2000,1999,1998,1997,1996,1995,1994,1993
Download
Bibliothek der Globalstatistik →Central Europe and the Baltics →

GNI (constant 2010 US$)

Diese Statistik in anderen Ländern:

AfghanistanAlbaniaAlgeriaAndorraAngolaAntigua and BarbudaArab WorldArgentinaArmeniaAustraliaAustriaAzerbaijanBahamas, TheBahrainBangladeshBarbadosBelarusBelgiumBelizeBeninBermudaBhutanBoliviaBosnia and HerzegovinaBotswanaBrazilBrunei DarussalamBulgariaBurkina FasoBurundiCabo VerdeCambodiaCameroonCanadaCaribbean small statesCentral African RepublicCentral Europe and the BalticsChadChileChinaColombiaComorosCongo, Dem. Rep.Congo, Rep.Costa RicaCote d'IvoireCroatiaCubaCyprusCzech RepublicDenmarkDominicaDominican RepublicEarly-demographic dividendEast Asia & PacificEast Asia & Pacific (excluding high income)East Asia & Pacific (IDA & IBRD countries)EcuadorEgypt, Arab Rep.El SalvadorEquatorial GuineaEritreaEstoniaEthiopiaEuro areaEurope & Central AsiaEurope & Central Asia (excluding high income)Europe & Central Asia (IDA & IBRD countries)European UnionFaroe IslandsFijiFinlandFragile and conflict affected situationsFranceGabonGambia, TheGeorgiaGermanyGhanaGreeceGrenadaGuatemalaGuineaGuinea-BissauGuyanaHaitiHeavily indebted poor countries (HIPC)High incomeHondurasHong Kong SAR, ChinaHungaryIBRD onlyIcelandIDA & IBRD totalIDA blendIDA onlyIDA totalIndiaIndonesiaIran, Islamic Rep.IraqIrelandIsle of ManIsraelItalyJamaicaJapanJordanKazakhstanKenyaKiribatiKorea, Rep.KosovoKuwaitKyrgyz RepublicLao PDRLate-demographic dividendLatin America & Caribbean Latin America & Caribbean (excluding high income)Latin America & the Caribbean (IDA & IBRD countries)LatviaLeast developed countries: UN classificationLebanonLesothoLiberiaLibyaLiechtensteinLithuaniaLow & middle incomeLow incomeLower middle incomeLuxembourgMacao SAR, ChinaMacedonia, FYRMadagascarMalawiMalaysiaMaldivesMaliMaltaMarshall IslandsMauritaniaMauritiusMexicoMicronesia, Fed. Sts.Middle East & North AfricaMiddle East & North Africa (excluding high income)Middle East & North Africa (IDA & IBRD countries)Middle incomeMoldovaMongoliaMontenegroMoroccoMozambiqueMyanmarNamibiaNauruNepalNetherlandsNew ZealandNicaraguaNigerNigeriaNorth AmericaNorwayOECD membersOmanOther small statesPacific island small statesPakistanPalauPanamaPapua New GuineaParaguayPeruPhilippinesPolandPortugalPost-demographic dividendPre-demographic dividendPuerto RicoQatarRomaniaRussian FederationRwandaSamoaSao Tome and PrincipeSaudi ArabiaSenegalSerbiaSeychellesSierra LeoneSingaporeSlovak RepublicSloveniaSmall statesSolomon IslandsSouth AfricaSouth AsiaSouth Asia (IDA & IBRD)South SudanSpainSri LankaSt. Kitts and NevisSt. LuciaSt. Vincent and the GrenadinesSub-Saharan Africa Sub-Saharan Africa (excluding high income)Sub-Saharan Africa (IDA & IBRD countries)SudanSurinameSwazilandSwedenSwitzerlandTajikistanTanzaniaThailandTimor-LesteTogoTongaTrinidad and TobagoTunisiaTurkeyTurkmenistanTuvaluUgandaUkraineUnited Arab EmiratesUnited KingdomUnited StatesUpper middle incomeUruguayUzbekistanVanuatuVenezuela, RBVietnamWest Bank and GazaWorldYemen, Rep.ZambiaZimbabwe

Zeitlinie:

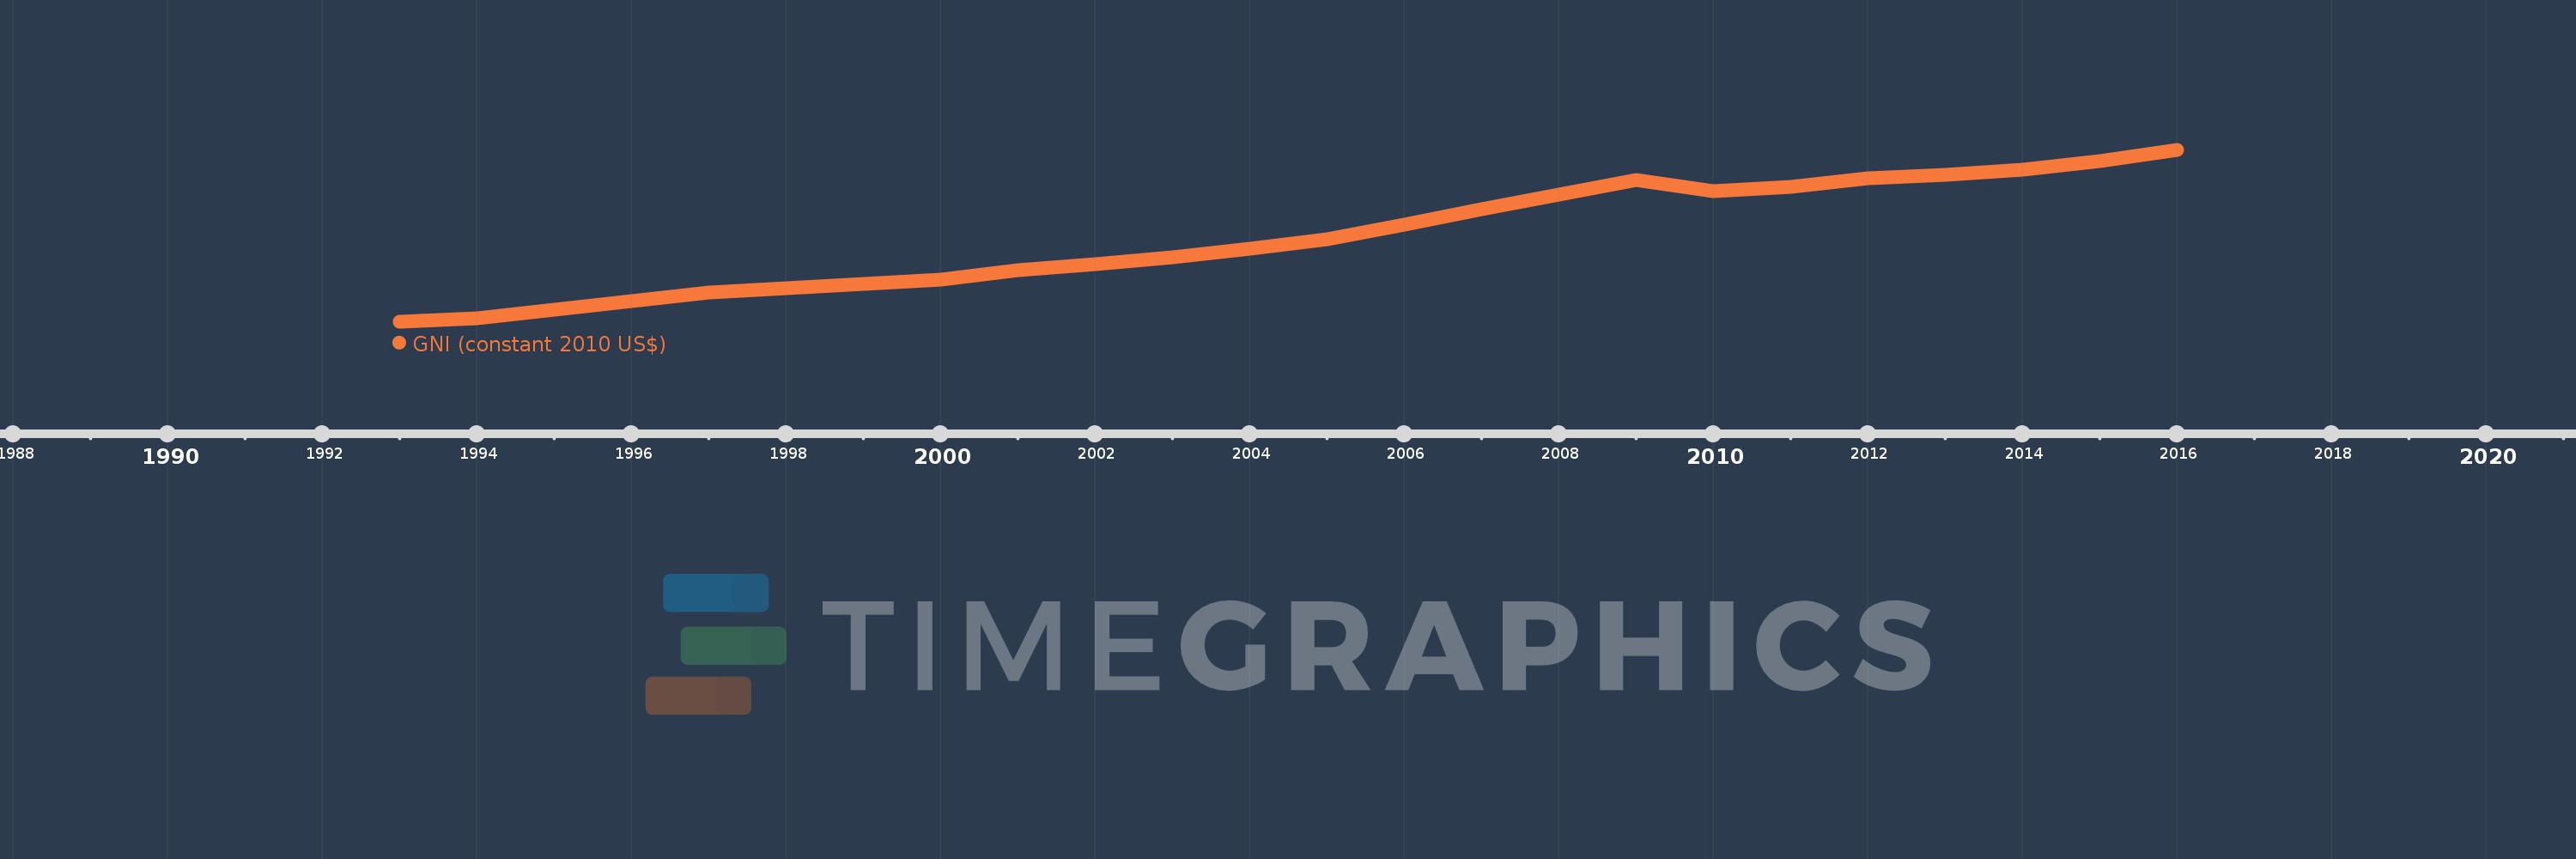
Diese Zeitleiste vorliegt die Graphik ab 1993 J. bis 2016 J. Central Europe and the Baltics. Die Angaben bis 1992 J. sind nicht vorhanden. Die Zahl aktueller Beobachtungen nach Daten: 24.

Die Quelle (Bezeichnung):

Kennzahlen der Weltentwicklung

Die Quelle (Einrichtung):

World Bank national accounts data, and OECD National Accounts data files.

Kategorien:

Economy & Growth

Es wurde aktualisiert:

23 Apr 2017 Jahr

Kennzahlen der Wertänderungen vom Jahr zum Jahr

im Durchschnitt:
1.052 Trln
Minimum:
695.536 Mlrd.
1 Jan 1993 Jahr
Maximum:
1.419 Trln
1 Jan 2016 Jahr
Zum Datum der Beobachtung
Wert
Absolute Veränderung
Die Veränderung bezüglich dem vorherigen Wert
1 Jan 1993 Jahr
695.536 Mlrd.
+695.536 Mlrd.
0.0%
1 Jan 1994 Jahr
709.726 Mlrd.
+14.19 Mlrd.
2.04%
1 Jan 1995 Jahr
745.914 Mlrd.
+36.188 Mlrd.
5.1%
1 Jan 1996 Jahr
784.498 Mlrd.
+38.584 Mlrd.
5.17%
1 Jan 1997 Jahr
818.085 Mlrd.
+33.587 Mlrd.
4.28%
1 Jan 1998 Jahr
836.728 Mlrd.
+18.643 Mlrd.
2.28%
1 Jan 1999 Jahr
856.14 Mlrd.
+19.412 Mlrd.
2.32%
1 Jan 2000 Jahr
874.182 Mlrd.
+18.042 Mlrd.
2.11%
1 Jan 2001 Jahr
912.513 Mlrd.
+38.331 Mlrd.
4.38%
1 Jan 2002 Jahr
939.125 Mlrd.
+26.612 Mlrd.
2.92%
1 Jan 2003 Jahr
968.083 Mlrd.
+28.958 Mlrd.
3.08%
1 Jan 2004 Jahr
1.005 Trln
+36.437 Mlrd.
3.76%
1 Jan 2005 Jahr
1.046 Trln
+41.019 Mlrd.
4.08%
1 Jan 2006 Jahr
1.105 Trln
+59.71 Mlrd.
5.71%
1 Jan 2007 Jahr
1.171 Trln
+65.347 Mlrd.
5.91%
1 Jan 2008 Jahr
1.233 Trln
+62.54 Mlrd.
5.34%
1 Jan 2009 Jahr
1.292 Trln
+58.844 Mlrd.
4.77%
1 Jan 2010 Jahr
1.248 Trln
-44.12 Mlrd.
-3.41%
1 Jan 2011 Jahr
1.265 Trln
+16.892 Mlrd.
1.35%
1 Jan 2012 Jahr
1.301 Trln
+36.411 Mlrd.
2.88%
1 Jan 2013 Jahr
1.315 Trln
+13.378 Mlrd.
1.03%
1 Jan 2014 Jahr
1.337 Trln
+22.589 Mlrd.
1.72%
1 Jan 2015 Jahr
1.374 Trln
+36.514 Mlrd.
2.73%
1 Jan 2016 Jahr
1.419 Trln
+45.041 Mlrd.
3.28%

Bewertung der Länder gemäß mit laufender Statistik nach Jahren