30
/de/
AIzaSyAYiBZKx7MnpbEhh9jyipgxe19OcubqV5w
April 1, 2024
25539
Central Europe and the Baltics
CEB
false
2
1
Children out of school, primary, female
2015,2014,2013,2012,2011,2010,2009,2008,2007,2006,2005,2004,2003,2002,2001,2000,1999,1998
Download
Bibliothek der Globalstatistik →Central Europe and the Baltics →

Children out of school, primary, female

Diese Statistik in anderen Ländern:

AfghanistanAlbaniaAlgeriaAngolaAntigua and BarbudaArab WorldArgentinaArmeniaArubaAustraliaAustriaAzerbaijanBahamas, TheBahrainBangladeshBarbadosBelarusBelgiumBelizeBeninBermudaBhutanBoliviaBosnia and HerzegovinaBotswanaBrazilBrunei DarussalamBulgariaBurkina FasoBurundiCabo VerdeCambodiaCameroonCanadaCaribbean small statesCentral African RepublicCentral Europe and the BalticsChadChileChinaColombiaComorosCongo, Dem. Rep.Congo, Rep.Costa RicaCote d'IvoireCroatiaCubaCyprusDenmarkDjiboutiDominicaDominican RepublicEarly-demographic dividendEast Asia & PacificEast Asia & Pacific (excluding high income)East Asia & Pacific (IDA & IBRD countries)EcuadorEgypt, Arab Rep.El SalvadorEquatorial GuineaEritreaEstoniaEthiopiaEuro areaEurope & Central AsiaEurope & Central Asia (excluding high income)Europe & Central Asia (IDA & IBRD countries)European UnionFijiFinlandFragile and conflict affected situationsFranceGabonGambia, TheGeorgiaGhanaGreeceGrenadaGuatemalaGuineaGuinea-BissauGuyanaHaitiHeavily indebted poor countries (HIPC)High incomeHondurasHong Kong SAR, ChinaHungaryIBRD onlyIcelandIDA & IBRD totalIDA blendIDA onlyIDA totalIndiaIndonesiaIran, Islamic Rep.IraqIrelandIsraelItalyJamaicaJapanJordanKazakhstanKenyaKiribatiKorea, Dem. People’s Rep.Korea, Rep.KuwaitKyrgyz RepublicLao PDRLate-demographic dividendLatin America & Caribbean Latin America & Caribbean (excluding high income)Latin America & the Caribbean (IDA & IBRD countries)LatviaLeast developed countries: UN classificationLebanonLesothoLiberiaLibyaLiechtensteinLithuaniaLow & middle incomeLow incomeLower middle incomeLuxembourgMacao SAR, ChinaMacedonia, FYRMadagascarMalawiMaldivesMaliMaltaMarshall IslandsMauritaniaMauritiusMexicoMicronesia, Fed. Sts.Middle East & North AfricaMiddle East & North Africa (excluding high income)Middle East & North Africa (IDA & IBRD countries)Middle incomeMoldovaMongoliaMontenegroMoroccoMozambiqueMyanmarNamibiaNauruNepalNetherlandsNew ZealandNicaraguaNigerNigeriaNorth AmericaNorwayOECD membersOmanOther small statesPacific island small statesPakistanPanamaPapua New GuineaParaguayPeruPhilippinesPolandPortugalPost-demographic dividendPre-demographic dividendPuerto RicoQatarRomaniaRussian FederationRwandaSamoaSan MarinoSao Tome and PrincipeSaudi ArabiaSenegalSerbiaSeychellesSierra LeoneSloveniaSmall statesSolomon IslandsSomaliaSouth AfricaSouth AsiaSouth Asia (IDA & IBRD)South SudanSpainSri LankaSt. Kitts and NevisSt. LuciaSt. Vincent and the GrenadinesSub-Saharan Africa Sub-Saharan Africa (excluding high income)Sub-Saharan Africa (IDA & IBRD countries)SudanSurinameSwazilandSwedenSwitzerlandSyrian Arab RepublicTajikistanTanzaniaThailandTimor-LesteTogoTongaTrinidad and TobagoTunisiaTurkeyTuvaluUgandaUkraineUnited Arab EmiratesUnited KingdomUnited StatesUpper middle incomeUruguayUzbekistanVanuatuVenezuela, RBWest Bank and GazaWorldYemen, Rep.ZambiaZimbabwe

Zeitlinie:

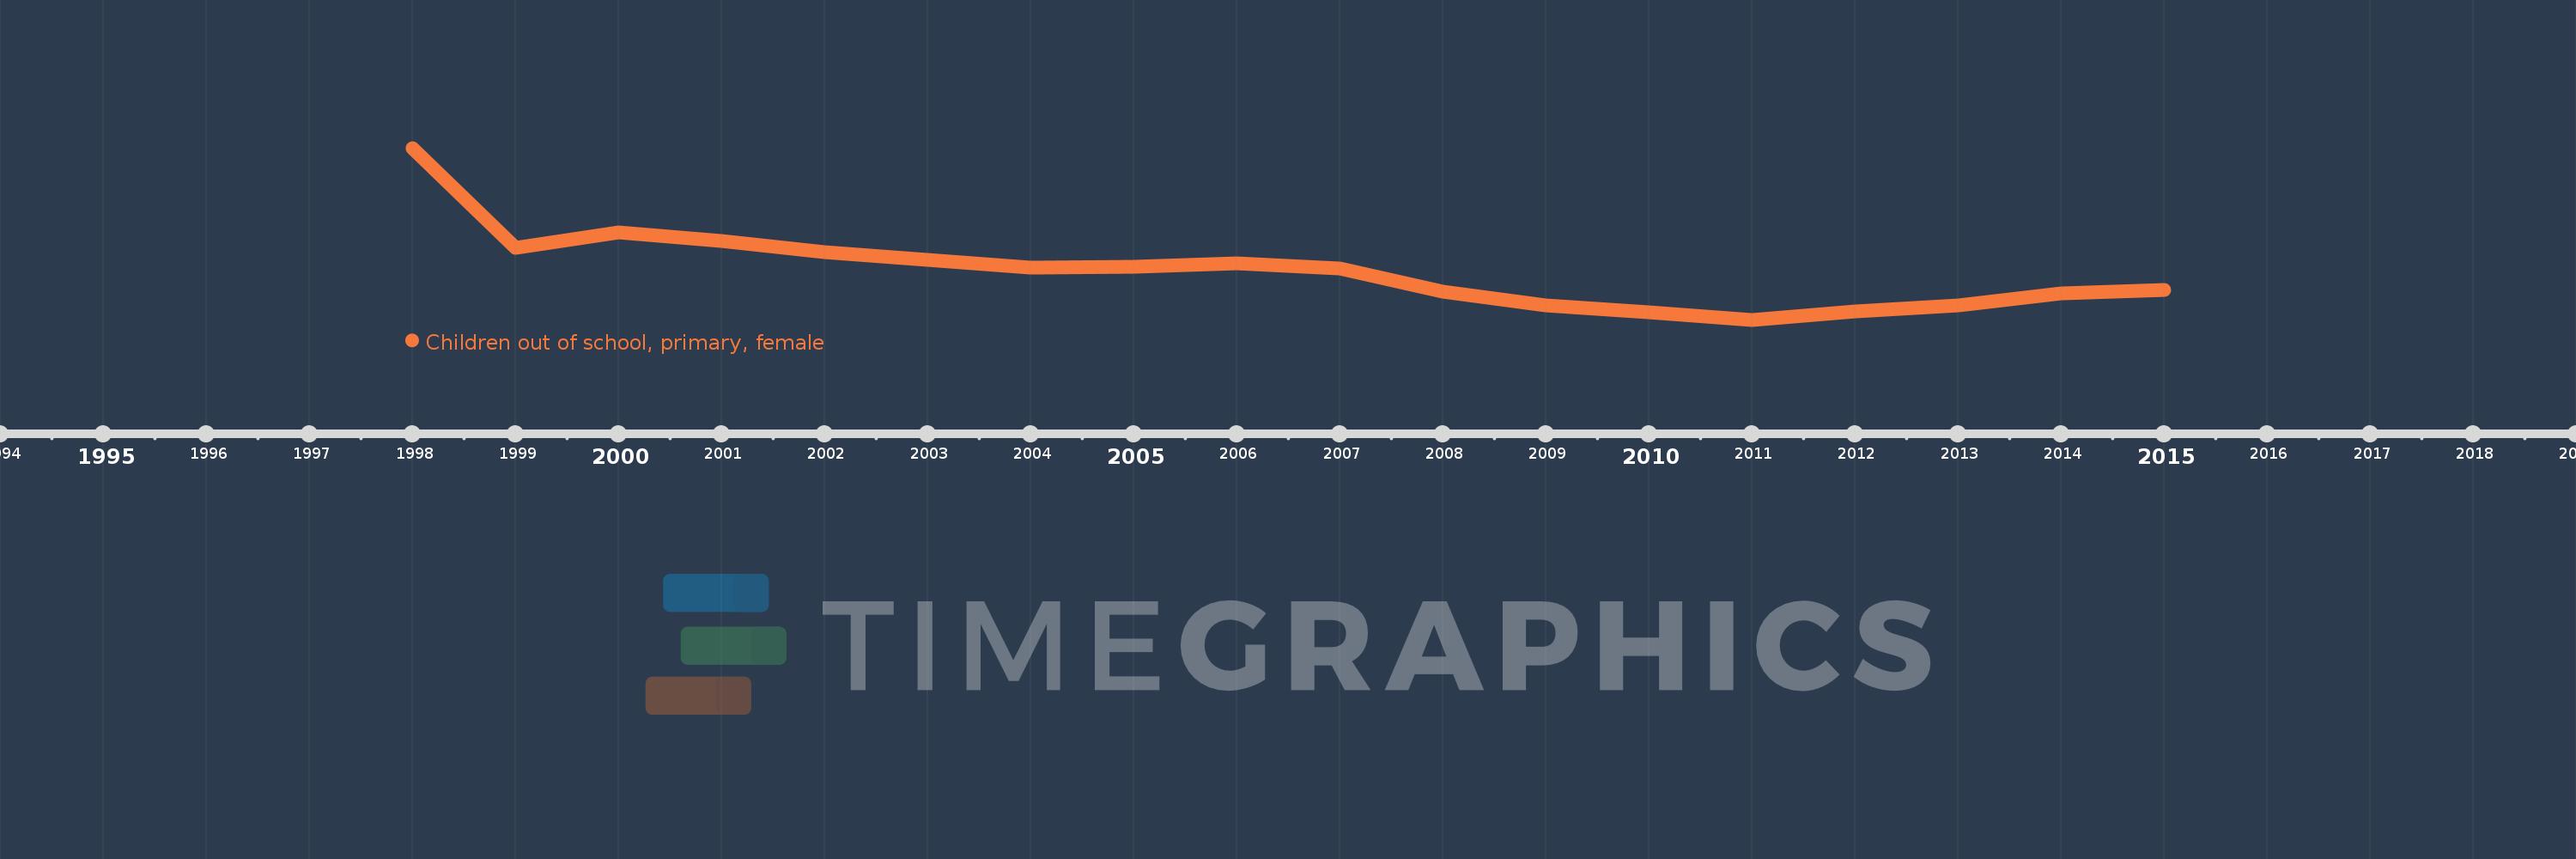
Diese Zeitleiste vorliegt die Graphik ab 1998 J. bis 2015 J. Central Europe and the Baltics. Die Angaben bis 1997 J. sind nicht vorhanden. Die Zahl aktueller Beobachtungen nach Daten: 18.

Die Quelle (Bezeichnung):

Kennzahlen der Weltentwicklung

Die Quelle (Einrichtung):

United Nations Educational, Scientific, and Cultural Organization (UNESCO) Institute for Statistics.

Kategorien:

Education, Gender

Es wurde aktualisiert:

23 Apr 2017 Jahr

Kennzahlen der Wertänderungen vom Jahr zum Jahr

im Durchschnitt:
122.14 Tsnd.
Minimum:
73.028 Tsnd.
1 Jan 2011 Jahr
Maximum:
245.951 Tsnd.
1 Jan 1998 Jahr
Zum Datum der Beobachtung
Wert
Absolute Veränderung
Die Veränderung bezüglich dem vorherigen Wert
1 Jan 1998 Jahr
245.951 Tsnd.
+245.951 Tsnd.
0.0%
1 Jan 1999 Jahr
145.723 Tsnd.
-100.228 Tsnd.
-40.75%
1 Jan 2000 Jahr
160.857 Tsnd.
+15.134 Tsnd.
10.39%
1 Jan 2001 Jahr
151.981 Tsnd.
-8.876 Tsnd.
-5.52%
1 Jan 2002 Jahr
140.935 Tsnd.
-11.046 Tsnd.
-7.27%
1 Jan 2003 Jahr
133.166 Tsnd.
-7.769 Tsnd.
-5.51%
1 Jan 2004 Jahr
125.575 Tsnd.
-7.591 Tsnd.
-5.7%
1 Jan 2005 Jahr
125.978 Tsnd.
+403.0
0.32%
1 Jan 2006 Jahr
129.705 Tsnd.
+3.727 Tsnd.
2.96%
1 Jan 2007 Jahr
124.349 Tsnd.
-5.356 Tsnd.
-4.13%
1 Jan 2008 Jahr
101.154 Tsnd.
-23.195 Tsnd.
-18.65%
1 Jan 2009 Jahr
87.772 Tsnd.
-13.382 Tsnd.
-13.23%
1 Jan 2010 Jahr
80.595 Tsnd.
-7.177 Tsnd.
-8.18%
1 Jan 2011 Jahr
73.028 Tsnd.
-7.567 Tsnd.
-9.39%
1 Jan 2012 Jahr
81.481 Tsnd.
+8.453 Tsnd.
11.58%
1 Jan 2013 Jahr
87.209 Tsnd.
+5.728 Tsnd.
7.03%
1 Jan 2014 Jahr
99.899 Tsnd.
+12.69 Tsnd.
14.55%
1 Jan 2015 Jahr
103.167 Tsnd.
+3.268 Tsnd.
3.27%

Bewertung der Länder gemäß mit laufender Statistik nach Jahren