30
/de/
AIzaSyAYiBZKx7MnpbEhh9jyipgxe19OcubqV5w
April 1, 2024
251629
St. Vincent and the Grenadines
VCT
true
2
1
All education staff compensation, total (% of total expenditure in public institutions)
2011,2010,2008,2006,2003,2001
Download
Bibliothek der Globalstatistik →St. Vincent and the Grenadines →

All education staff compensation, total (% of total expenditure in public institutions)

Diese Statistik in anderen Ländern:

AfghanistanAlbaniaAndorraAntigua and BarbudaArgentinaArmeniaArubaAustraliaAustriaAzerbaijanBahrainBangladeshBarbadosBelarusBelgiumBelizeBeninBoliviaBrazilBritish Virgin IslandsBulgariaBurkina FasoBurundiCabo VerdeCameroonCanadaCaribbean small statesCayman IslandsCentral African RepublicCentral Europe and the BalticsChileChinaColombiaComorosCongo, Dem. Rep.Cote d'IvoireCroatiaCubaCuracaoCyprusCzech RepublicDenmarkDjiboutiDominicaDominican RepublicEcuadorEl SalvadorEritreaEstoniaEthiopiaEuro areaEurope & Central AsiaEurope & Central Asia (excluding high income)Europe & Central Asia (IDA & IBRD countries)European UnionFijiFinlandFranceGambia, TheGermanyGhanaGreeceGrenadaGuatemalaGuineaGuinea-BissauGuyanaHigh incomeHondurasHungaryIcelandIndiaIndonesiaIrelandIsraelItalyJamaicaJapanJordanKazakhstanKorea, Rep.KuwaitKyrgyz RepublicLate-demographic dividendLatin America & Caribbean Latin America & Caribbean (excluding high income)Latin America & the Caribbean (IDA & IBRD countries)LatviaLebanonLesothoLiberiaLiechtensteinLithuaniaLuxembourgMacao SAR, ChinaMacedonia, FYRMadagascarMalawiMalaysiaMaliMaltaMarshall IslandsMexicoMoldovaMonacoMongoliaMoroccoMozambiqueNamibiaNauruNetherlandsNicaraguaNigerNorth AmericaNorwayOECD membersOmanPakistanPanamaParaguayPeruPhilippinesPolandPortugalPost-demographic dividendPuerto RicoQatarRomaniaRussian FederationRwandaSan MarinoSenegalSerbiaSeychellesSierra LeoneSlovak RepublicSloveniaSouth AfricaSpainSri LankaSt. Kitts and NevisSt. LuciaSt. Vincent and the GrenadinesSwedenSwitzerlandThailandTimor-LesteTogoTunisiaTurkeyTurks and Caicos IslandsUgandaUkraineUnited KingdomUnited StatesUruguayVanuatuVenezuela, RBVietnamWest Bank and GazaZambia

Zeitlinie:

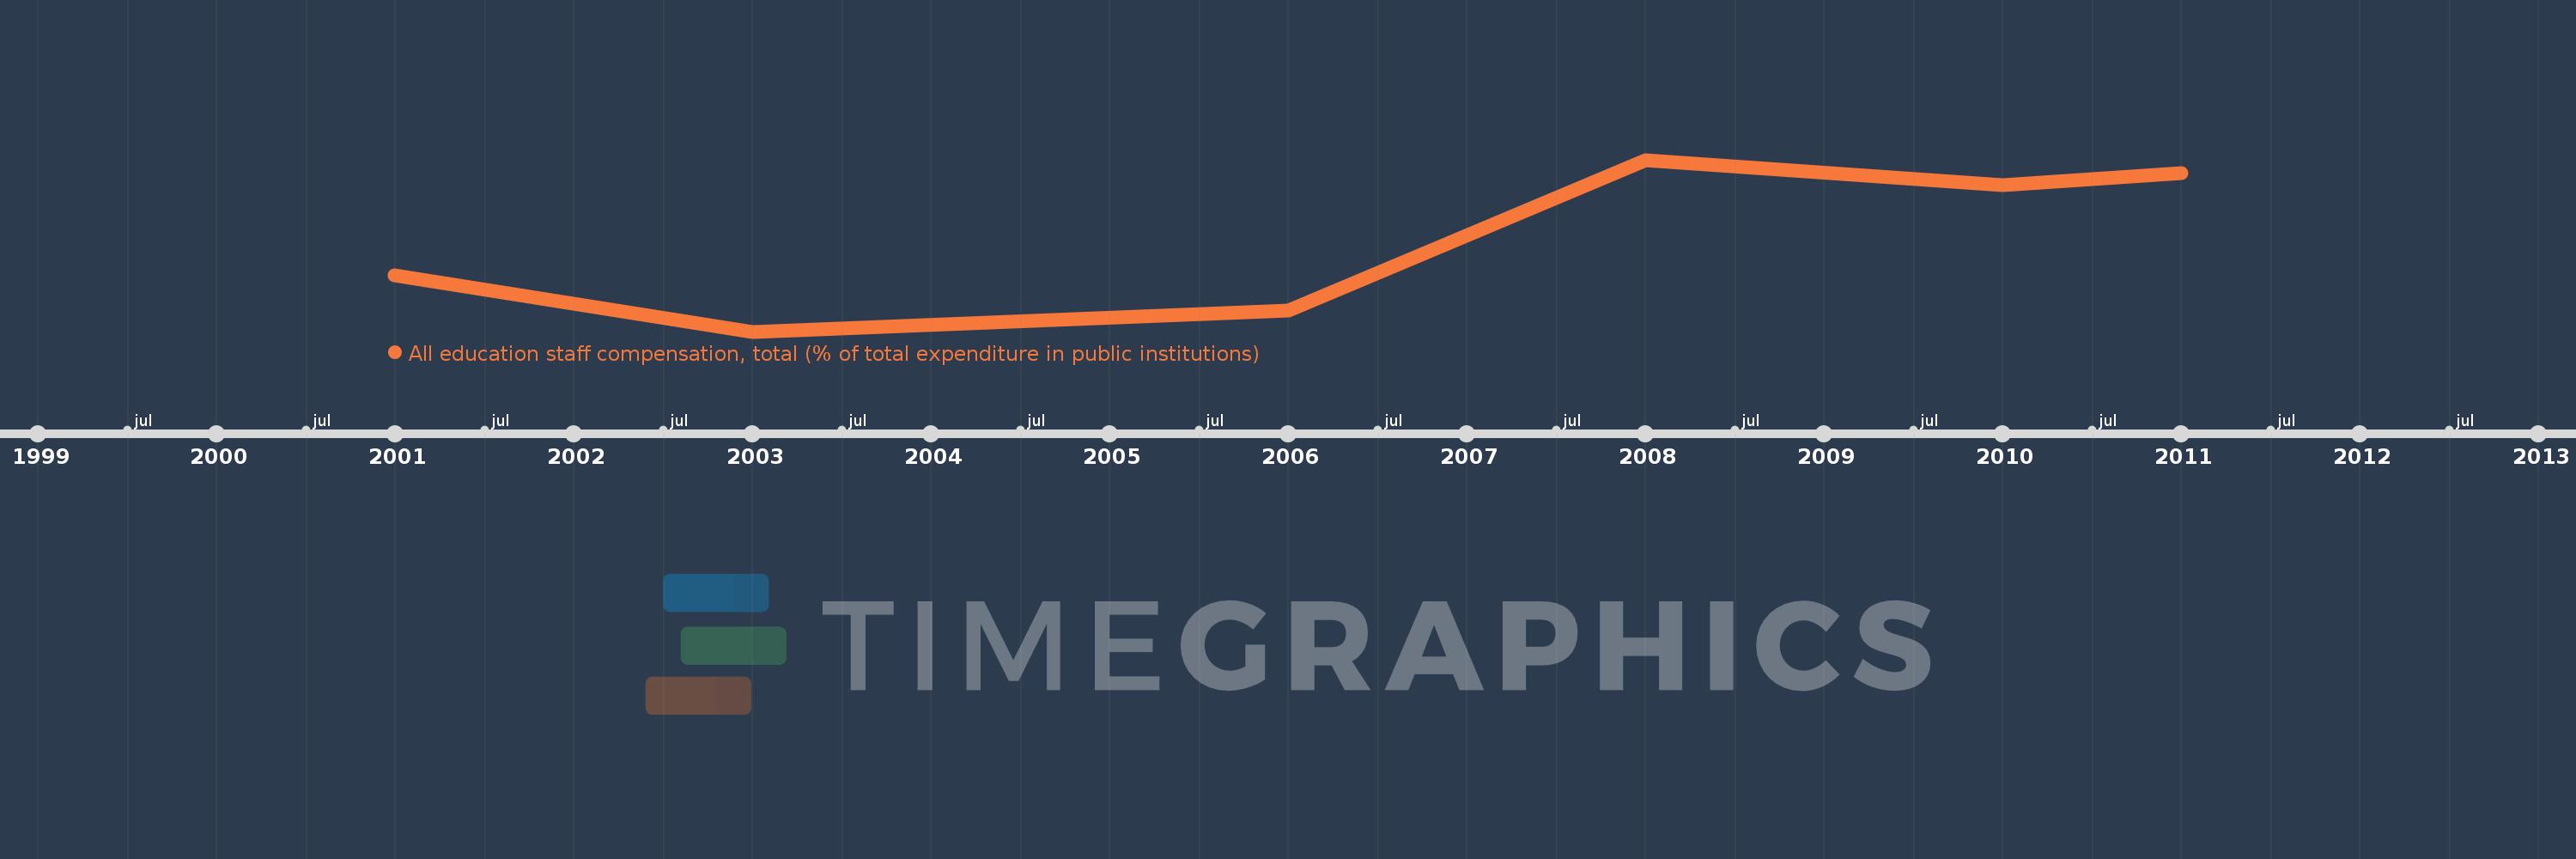
Diese Zeitleiste vorliegt die Graphik ab 2001 J. bis 2011 J. St. Vincent and the Grenadines. Die Angaben bis 2000 J. sind nicht vorhanden. Die Zahl aktueller Beobachtungen nach Daten: 6.

Die Quelle (Bezeichnung):

Kennzahlen der Weltentwicklung

Die Quelle (Einrichtung):

United Nations Educational, Scientific, and Cultural Organization (UNESCO) Institute for Statistics.

Kategorien:

Education

Es wurde aktualisiert:

23 Apr 2017 Jahr

Kennzahlen der Wertänderungen vom Jahr zum Jahr

im Durchschnitt:
73.932
Minimum:
45.39
1 Jan 2003 Jahr
Maximum:
98.557
1 Jan 2008 Jahr
Zum Datum der Beobachtung
Wert
Absolute Veränderung
Die Veränderung bezüglich dem vorherigen Wert
1 Jan 2001 Jahr
62.704
+62.704
0.0%
1 Jan 2003 Jahr
45.39
-17.314
-27.61%
1 Jan 2006 Jahr
51.858
+6.468
14.25%
1 Jan 2008 Jahr
98.557
+46.699
90.05%
1 Jan 2010 Jahr
90.667
-7.889
-8.0%
1 Jan 2011 Jahr
94.417
+3.749
4.14%

Bewertung der Länder gemäß mit laufender Statistik nach Jahren