29
/de/
de
AIzaSyAYiBZKx7MnpbEhh9jyipgxe19OcubqV5w
April 1, 2024
250288
St. Kitts and Nevis
KNA
true
2
1
School enrollment, secondary, male (% gross)
2015,2014,2013,2012,2011,2010,2009,2008,2006,2005,2004,2003,2002,2001,1994,1993,1990,1989,1988,1987,1986,1985
Download
Bibliothek der Globalstatistik →St. Kitts and Nevis →

School enrollment, secondary, male (% gross)

Diese Statistik in anderen Ländern:
AfghanistanAlbaniaAlgeriaAndorraAngolaAntigua and BarbudaArab WorldArgentinaArmeniaArubaAustraliaAustriaAzerbaijanBahamas, TheBahrainBangladeshBarbadosBelarusBelgiumBelizeBeninBermudaBhutanBoliviaBosnia and HerzegovinaBotswanaBrazilBrunei DarussalamBulgariaBurkina FasoBurundiCabo VerdeCambodiaCameroonCanadaCaribbean small statesCentral African RepublicCentral Europe and the BalticsChadChileChinaColombiaComorosCongo, Dem. Rep.Congo, Rep.Costa RicaCote d'IvoireCroatiaCubaCuracaoCyprusCzech RepublicDenmarkDjiboutiDominicaDominican RepublicEarly-demographic dividendEast Asia & PacificEast Asia & Pacific (excluding high income)East Asia & Pacific (IDA & IBRD countries)EcuadorEgypt, Arab Rep.El SalvadorEquatorial GuineaEritreaEstoniaEthiopiaEuro areaEurope & Central AsiaEurope & Central Asia (excluding high income)Europe & Central Asia (IDA & IBRD countries)European UnionFijiFinlandFragile and conflict affected situationsFranceGabonGambia, TheGeorgiaGermanyGhanaGreeceGrenadaGuatemalaGuineaGuinea-BissauGuyanaHeavily indebted poor countries (HIPC)High incomeHondurasHong Kong SAR, ChinaHungaryIBRD onlyIcelandIDA & IBRD totalIDA blendIDA onlyIDA totalIndiaIndonesiaIran, Islamic Rep.IraqIrelandIsraelItalyJamaicaJapanJordanKazakhstanKenyaKiribatiKorea, Dem. People’s Rep.Korea, Rep.KuwaitKyrgyz RepublicLao PDRLate-demographic dividendLatin America & Caribbean Latin America & Caribbean (excluding high income)Latin America & the Caribbean (IDA & IBRD countries)LatviaLeast developed countries: UN classificationLebanonLesothoLiberiaLibyaLiechtensteinLithuaniaLow & middle incomeLow incomeLower middle incomeLuxembourgMacao SAR, ChinaMacedonia, FYRMadagascarMalawiMaldivesMaliMaltaMarshall IslandsMauritaniaMauritiusMexicoMicronesia, Fed. Sts.Middle East & North AfricaMiddle East & North Africa (excluding high income)Middle East & North Africa (IDA & IBRD countries)Middle incomeMoldovaMongoliaMontenegroMoroccoMozambiqueMyanmarNamibiaNauruNepalNetherlandsNew ZealandNicaraguaNigerNigeriaNorth AmericaNorwayOECD membersOmanOther small statesPacific island small statesPakistanPalauPanamaPapua New GuineaParaguayPeruPhilippinesPolandPortugalPost-demographic dividendPre-demographic dividendPuerto RicoQatarRomaniaRussian FederationRwandaSamoaSan MarinoSao Tome and PrincipeSaudi ArabiaSenegalSerbiaSeychellesSierra LeoneSlovak RepublicSloveniaSmall statesSolomon IslandsSomaliaSouth AfricaSouth AsiaSouth Asia (IDA & IBRD)SpainSri LankaSt. Kitts and NevisSt. LuciaSt. Vincent and the GrenadinesSub-Saharan Africa Sub-Saharan Africa (excluding high income)Sub-Saharan Africa (IDA & IBRD countries)SudanSurinameSwazilandSwedenSwitzerlandSyrian Arab RepublicTajikistanTanzaniaThailandTimor-LesteTogoTongaTrinidad and TobagoTunisiaTurkeyTurkmenistanTuvaluUgandaUkraineUnited Arab EmiratesUnited KingdomUnited StatesUpper middle incomeUruguayUzbekistanVanuatuVenezuela, RBVietnamWest Bank and GazaWorldYemen, Rep.ZambiaZimbabwe
Zeitlinie:
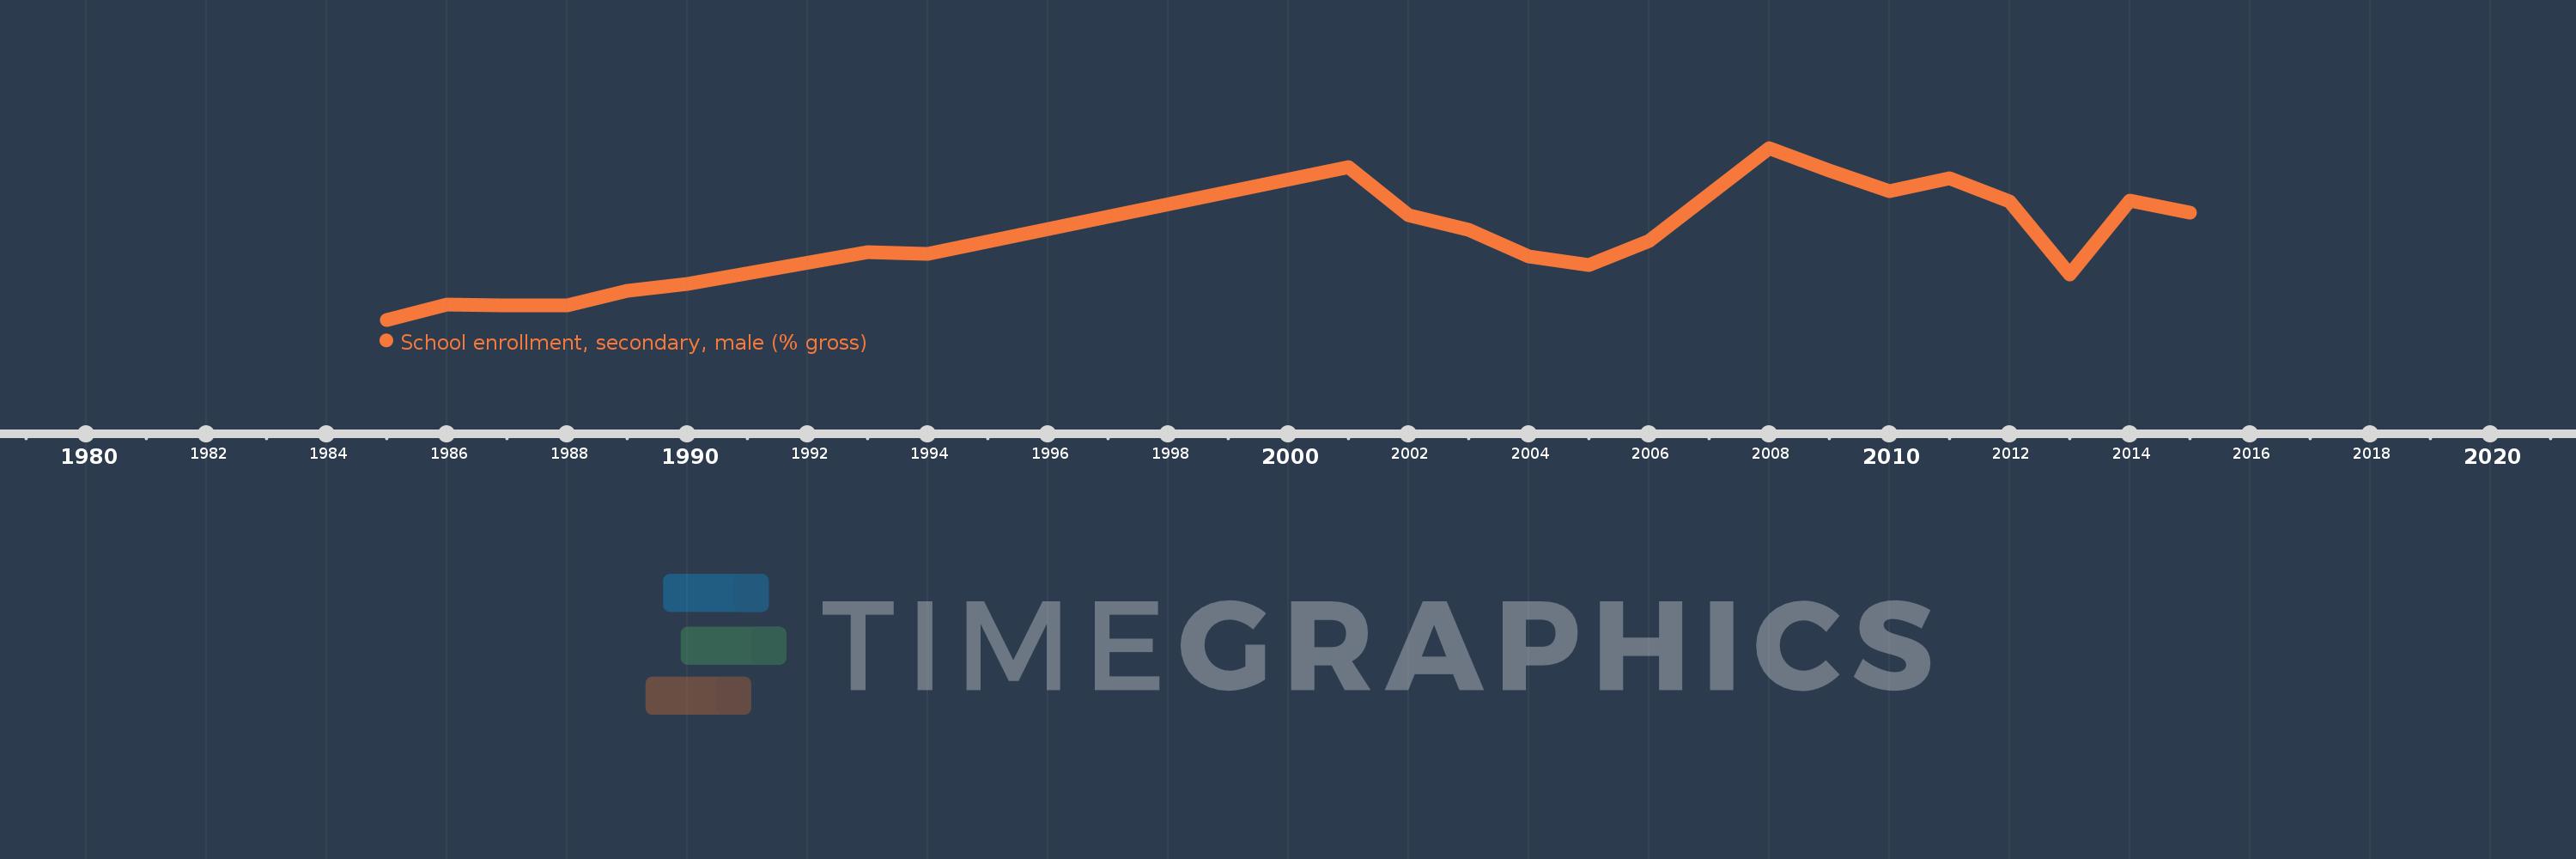
Diese Zeitleiste vorliegt die Graphik ab 1985 J. bis 2015 J. St. Kitts and Nevis. Die Angaben bis 1984 J. sind nicht vorhanden. Die Zahl aktueller Beobachtungen nach Daten: 22.
Die Quelle (Bezeichnung):
Kennzahlen der Weltentwicklung
Die Quelle (Einrichtung):
United Nations Educational, Scientific, and Cultural Organization (UNESCO) Institute for Statistics.
Kategorien:
Education, Gender
Es wurde aktualisiert:
23 Apr 2017 Jahr
Kennzahlen der Wertänderungen vom Jahr zum Jahr
im Durchschnitt:
84.527
Minimum:
67.04
1 Jan 1985 Jahr
Maximum:
104.443
1 Jan 2008 Jahr
Zum Datum der Beobachtung
Wert
Absolute Veränderung
Die Veränderung bezüglich dem vorherigen Wert
1 Jan 1985 Jahr
67.04
+67.04
0.0%
1 Jan 1986 Jahr
70.331
+3.291
4.91%
1 Jan 1987 Jahr
70.248
-0.083
-0.12%
1 Jan 1988 Jahr
70.072
-0.176
-0.25%
1 Jan 1989 Jahr
73.345
+3.273
4.67%
1 Jan 1990 Jahr
74.789
+1.443
1.97%
1 Jan 1993 Jahr
81.801
+7.012
9.38%
1 Jan 1994 Jahr
81.325
-0.476
-0.58%
1 Jan 2001 Jahr
100.34
+19.015
23.38%
1 Jan 2002 Jahr
89.861
-10.479
-10.44%
1 Jan 2003 Jahr
86.708
-3.152
-3.51%
1 Jan 2004 Jahr
80.849
-5.859
-6.76%
1 Jan 2005 Jahr
79.014
-1.835
-2.27%
1 Jan 2006 Jahr
84.106
+5.092
6.44%
1 Jan 2008 Jahr
104.443
+20.338
24.18%
1 Jan 2009 Jahr
99.54
-4.904
-4.7%
1 Jan 2010 Jahr
95.062
-4.478
-4.5%
1 Jan 2011 Jahr
97.896
+2.834
2.98%
1 Jan 2012 Jahr
92.736
-5.16
-5.27%
1 Jan 2013 Jahr
76.877
-15.859
-17.1%
1 Jan 2014 Jahr
92.905
+16.027
20.85%
1 Jan 2015 Jahr
90.315
-2.59
-2.79%
Bewertung der Länder gemäß mit laufender Statistik nach Jahren

Kommentare:

Abschicken
PremiumAbout & FeedbackVereinbarungPrivatheit
logo
© 2022 Selected Technologies LLC – Morgan Hill, California