30
/de/
AIzaSyAYiBZKx7MnpbEhh9jyipgxe19OcubqV5w
April 1, 2024
249697
St. Kitts and Nevis
KNA
true
2
1
Birth rate, crude (per 1,000 people)
2003,2002,1998,1997,1996,1993,1990,1989,1988,1987,1986,1985,1984,1983,1982,1981,1980,1979,1978,1977,1971
Download
Bibliothek der Globalstatistik →St. Kitts and Nevis →

Birth rate, crude (per 1,000 people)

Diese Statistik in anderen Ländern:

AfghanistanAlbaniaAlgeriaAmerican SamoaAndorraAngolaAntigua and BarbudaArab WorldArgentinaArmeniaArubaAustraliaAustriaAzerbaijanBahamas, TheBahrainBangladeshBarbadosBelarusBelgiumBelizeBeninBermudaBhutanBoliviaBosnia and HerzegovinaBotswanaBrazilBrunei DarussalamBulgariaBurkina FasoBurundiCabo VerdeCambodiaCameroonCanadaCaribbean small statesCayman IslandsCentral African RepublicCentral Europe and the BalticsChadChannel IslandsChileChinaColombiaComorosCongo, Dem. Rep.Congo, Rep.Costa RicaCote d'IvoireCroatiaCubaCuracaoCyprusCzech RepublicDenmarkDjiboutiDominicaDominican RepublicEarly-demographic dividendEast Asia & PacificEast Asia & Pacific (excluding high income)East Asia & Pacific (IDA & IBRD countries)EcuadorEgypt, Arab Rep.El SalvadorEquatorial GuineaEritreaEstoniaEthiopiaEuro areaEurope & Central AsiaEurope & Central Asia (excluding high income)Europe & Central Asia (IDA & IBRD countries)European UnionFaroe IslandsFijiFinlandFragile and conflict affected situationsFranceFrench PolynesiaGabonGambia, TheGeorgiaGermanyGhanaGreeceGreenlandGrenadaGuamGuatemalaGuineaGuinea-BissauGuyanaHaitiHeavily indebted poor countries (HIPC)High incomeHondurasHong Kong SAR, ChinaHungaryIBRD onlyIcelandIDA & IBRD totalIDA blendIDA onlyIDA totalIndiaIndonesiaIran, Islamic Rep.IraqIrelandIsle of ManIsraelItalyJamaicaJapanJordanKazakhstanKenyaKiribatiKorea, Dem. People’s Rep.Korea, Rep.KosovoKuwaitKyrgyz RepublicLao PDRLate-demographic dividendLatin America & Caribbean Latin America & Caribbean (excluding high income)Latin America & the Caribbean (IDA & IBRD countries)LatviaLeast developed countries: UN classificationLebanonLesothoLiberiaLibyaLiechtensteinLithuaniaLow & middle incomeLow incomeLower middle incomeLuxembourgMacao SAR, ChinaMacedonia, FYRMadagascarMalawiMalaysiaMaldivesMaliMaltaMarshall IslandsMauritaniaMauritiusMexicoMicronesia, Fed. Sts.Middle East & North AfricaMiddle East & North Africa (excluding high income)Middle East & North Africa (IDA & IBRD countries)Middle incomeMoldovaMonacoMongoliaMontenegroMoroccoMozambiqueMyanmarNamibiaNepalNetherlandsNew CaledoniaNew ZealandNicaraguaNigerNigeriaNorth AmericaNorwayOECD membersOmanOther small statesPacific island small statesPakistanPalauPanamaPapua New GuineaParaguayPeruPhilippinesPolandPortugalPost-demographic dividendPre-demographic dividendPuerto RicoQatarRomaniaRussian FederationRwandaSamoaSan MarinoSao Tome and PrincipeSaudi ArabiaSenegalSerbiaSeychellesSierra LeoneSingaporeSint Maarten (Dutch part)Slovak RepublicSloveniaSmall statesSolomon IslandsSomaliaSouth AfricaSouth AsiaSouth Asia (IDA & IBRD)South SudanSpainSri LankaSt. Kitts and NevisSt. LuciaSt. Martin (French part)St. Vincent and the GrenadinesSub-Saharan Africa Sub-Saharan Africa (excluding high income)Sub-Saharan Africa (IDA & IBRD countries)SudanSurinameSwazilandSwedenSwitzerlandSyrian Arab RepublicTajikistanTanzaniaThailandTimor-LesteTogoTongaTrinidad and TobagoTunisiaTurkeyTurkmenistanUgandaUkraineUnited Arab EmiratesUnited KingdomUnited StatesUpper middle incomeUruguayUzbekistanVanuatuVenezuela, RBVietnamVirgin Islands (U.S.)West Bank and GazaWorldYemen, Rep.ZambiaZimbabwe

Zeitlinie:

Diese Zeitleiste vorliegt die Graphik ab 1971 J. bis 2003 J. St. Kitts and Nevis. Die Angaben bis 1970 J. sind nicht vorhanden. Die Zahl aktueller Beobachtungen nach Daten: 21.

Die Quelle (Bezeichnung):

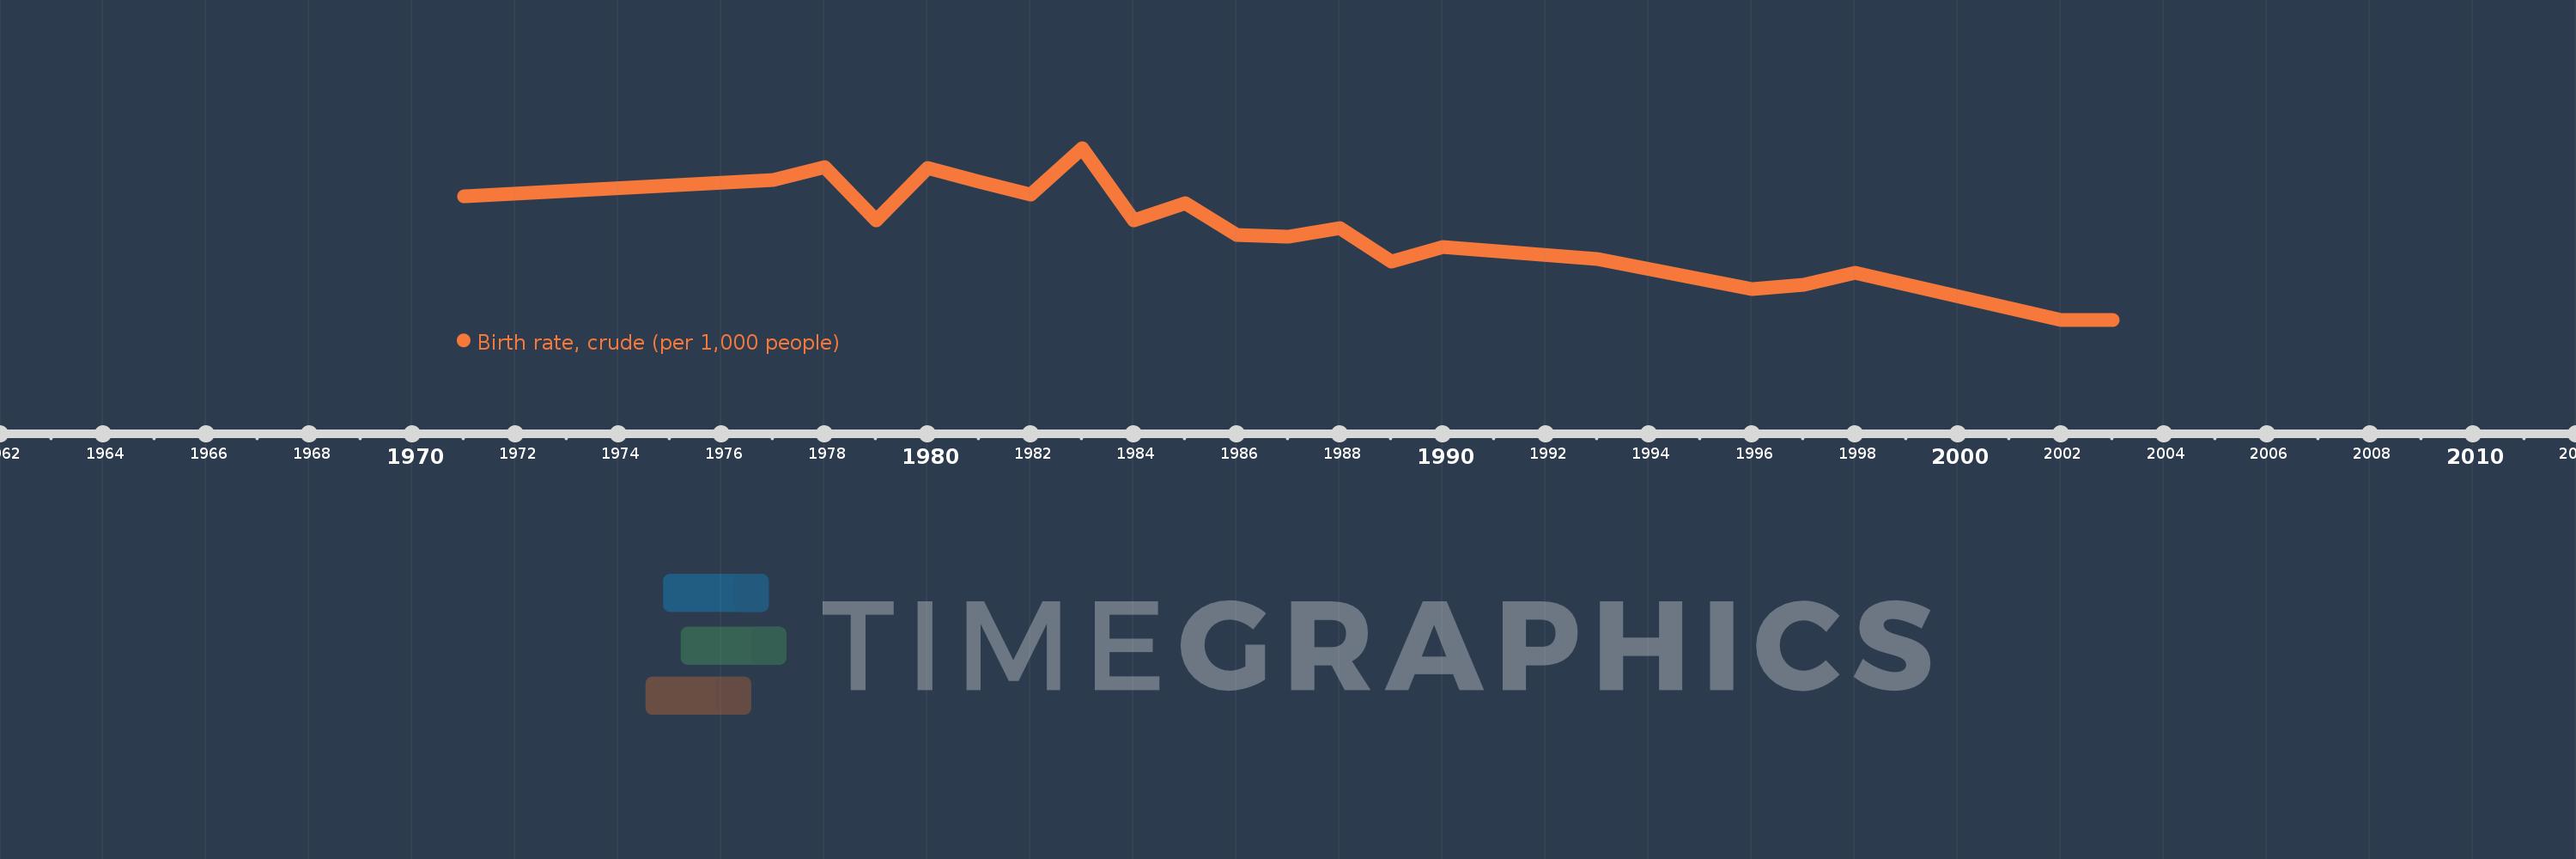
Kennzahlen der Weltentwicklung

Die Quelle (Einrichtung):

(1) United Nations Population Division. World Population Prospects, (2) Census reports and other statistical publications from national statistical offices, (3) Eurostat: Demographic Statistics, (4) United Nations Statistical Division. Population and Vital Statistics Reprot (various years), (5) U.S. Census Bureau: International Database, and (6) Secretariat of the Pacific Community: Statistics and Demography Programme.

Kategorien:

Health

Es wurde aktualisiert:

23 Apr 2017 Jahr

Kennzahlen der Wertänderungen vom Jahr zum Jahr

im Durchschnitt:
23.452
Minimum:
17.3
1 Jan 2002 Jahr
Maximum:
29.1
1 Jan 1983 Jahr
Zum Datum der Beobachtung
Wert
Absolute Veränderung
Die Veränderung bezüglich dem vorherigen Wert
1 Jan 1971 Jahr
25.8
+25.8
0.0%
1 Jan 1977 Jahr
26.9
+1.1
4.26%
1 Jan 1978 Jahr
27.8
+0.9
3.35%
1 Jan 1979 Jahr
24.1
-3.7
-13.31%
1 Jan 1980 Jahr
27.7
+3.6
14.94%
1 Jan 1981 Jahr
26.8
-0.9
-3.25%
1 Jan 1982 Jahr
25.9
-0.9
-3.36%
1 Jan 1983 Jahr
29.1
+3.2
12.36%
1 Jan 1984 Jahr
24.1
-5.0
-17.18%
1 Jan 1985 Jahr
25.3
+1.2
4.98%
1 Jan 1986 Jahr
23.1
-2.2
-8.7%
1 Jan 1987 Jahr
23.0
-0.1
-0.43%
1 Jan 1988 Jahr
23.6
+0.6
2.61%
1 Jan 1989 Jahr
21.3
-2.3
-9.75%
1 Jan 1990 Jahr
22.3
+1.0
4.69%
1 Jan 1993 Jahr
21.5
-0.8
-3.59%
1 Jan 1996 Jahr
19.4
-2.1
-9.77%
1 Jan 1997 Jahr
19.7
+0.3
1.55%
1 Jan 1998 Jahr
20.5
+0.8
4.06%
1 Jan 2002 Jahr
17.3
-3.2
-15.61%
1 Jan 2003 Jahr
17.3
0.0
0.0%

Bewertung der Länder gemäß mit laufender Statistik nach Jahren