33
/de/
AIzaSyAYiBZKx7MnpbEhh9jyipgxe19OcubqV5w
August 1, 2025
242338
Slovenia
SVN
true
2
1
Aquaculture production (metric tons)
2015,2014,2013,2012,2011,2010,2009,2008,2007,2006,2005,2004,2003,2002,2001,2000,1999,1998,1997,1996,1995,1994,1993
Download
Bibliothek der Globalstatistik →Slovenia →

Aquaculture production (metric tons)

Diese Statistik in anderen Ländern:

AfghanistanAlbaniaAlgeriaAmerican SamoaAngolaArab WorldArgentinaArmeniaArubaAustraliaAustriaAzerbaijanBahamas, TheBahrainBangladeshBarbadosBelarusBelgiumBelizeBeninBhutanBoliviaBosnia and HerzegovinaBrazilBrunei DarussalamBulgariaBurkina FasoBurundiCambodiaCameroonCanadaCaribbean small statesCentral African RepublicCentral Europe and the BalticsChadChannel IslandsChileChinaColombiaCongo, Dem. Rep.Congo, Rep.Costa RicaCote d'IvoireCroatiaCubaCyprusCzech RepublicDenmarkDominicaDominican RepublicEarly-demographic dividendEast Asia & PacificEast Asia & Pacific (excluding high income)East Asia & Pacific (IDA & IBRD countries)EcuadorEgypt, Arab Rep.El SalvadorEquatorial GuineaEritreaEstoniaEthiopiaEuro areaEurope & Central AsiaEurope & Central Asia (excluding high income)Europe & Central Asia (IDA & IBRD countries)European UnionFaroe IslandsFijiFinlandFragile and conflict affected situationsFranceFrench PolynesiaGabonGambia, TheGeorgiaGermanyGhanaGreeceGrenadaGuamGuatemalaGuineaGuyanaHaitiHeavily indebted poor countries (HIPC)High incomeHondurasHong Kong SAR, ChinaHungaryIBRD onlyIcelandIDA & IBRD totalIDA blendIDA onlyIDA totalIndiaIndonesiaIran, Islamic Rep.IraqIrelandIsraelItalyJamaicaJapanJordanKazakhstanKenyaKiribatiKorea, Dem. People’s Rep.Korea, Rep.KuwaitKyrgyz RepublicLao PDRLate-demographic dividendLatin America & Caribbean Latin America & Caribbean (excluding high income)Latin America & the Caribbean (IDA & IBRD countries)LatviaLeast developed countries: UN classificationLebanonLesothoLiberiaLibyaLithuaniaLow & middle incomeLow incomeLower middle incomeMacedonia, FYRMadagascarMalawiMalaysiaMaliMaltaMarshall IslandsMauritiusMexicoMicronesia, Fed. Sts.Middle East & North AfricaMiddle East & North Africa (excluding high income)Middle East & North Africa (IDA & IBRD countries)Middle incomeMoldovaMontenegroMoroccoMozambiqueMyanmarNamibiaNauruNepalNetherlandsNew CaledoniaNew ZealandNicaraguaNigerNigeriaNorth AmericaNorthern Mariana IslandsNorwayOECD membersOmanOther small statesPacific island small statesPakistanPalauPanamaPapua New GuineaParaguayPeruPhilippinesPolandPortugalPost-demographic dividendPre-demographic dividendPuerto RicoQatarRomaniaRussian FederationRwandaSamoaSaudi ArabiaSenegalSerbiaSeychellesSierra LeoneSingaporeSlovak RepublicSloveniaSmall statesSolomon IslandsSouth AfricaSouth AsiaSouth Asia (IDA & IBRD)South SudanSpainSri LankaSt. Kitts and NevisSt. LuciaSub-Saharan Africa Sub-Saharan Africa (excluding high income)Sub-Saharan Africa (IDA & IBRD countries)SudanSurinameSwazilandSwedenSwitzerlandSyrian Arab RepublicTajikistanTanzaniaThailandTimor-LesteTogoTongaTrinidad and TobagoTunisiaTurkeyTurkmenistanTurks and Caicos IslandsTuvaluUgandaUkraineUnited Arab EmiratesUnited KingdomUnited StatesUpper middle incomeUruguayUzbekistanVanuatuVenezuela, RBVietnamVirgin Islands (U.S.)West Bank and GazaWorldYemen, Rep.ZambiaZimbabwe

Zeitlinie:

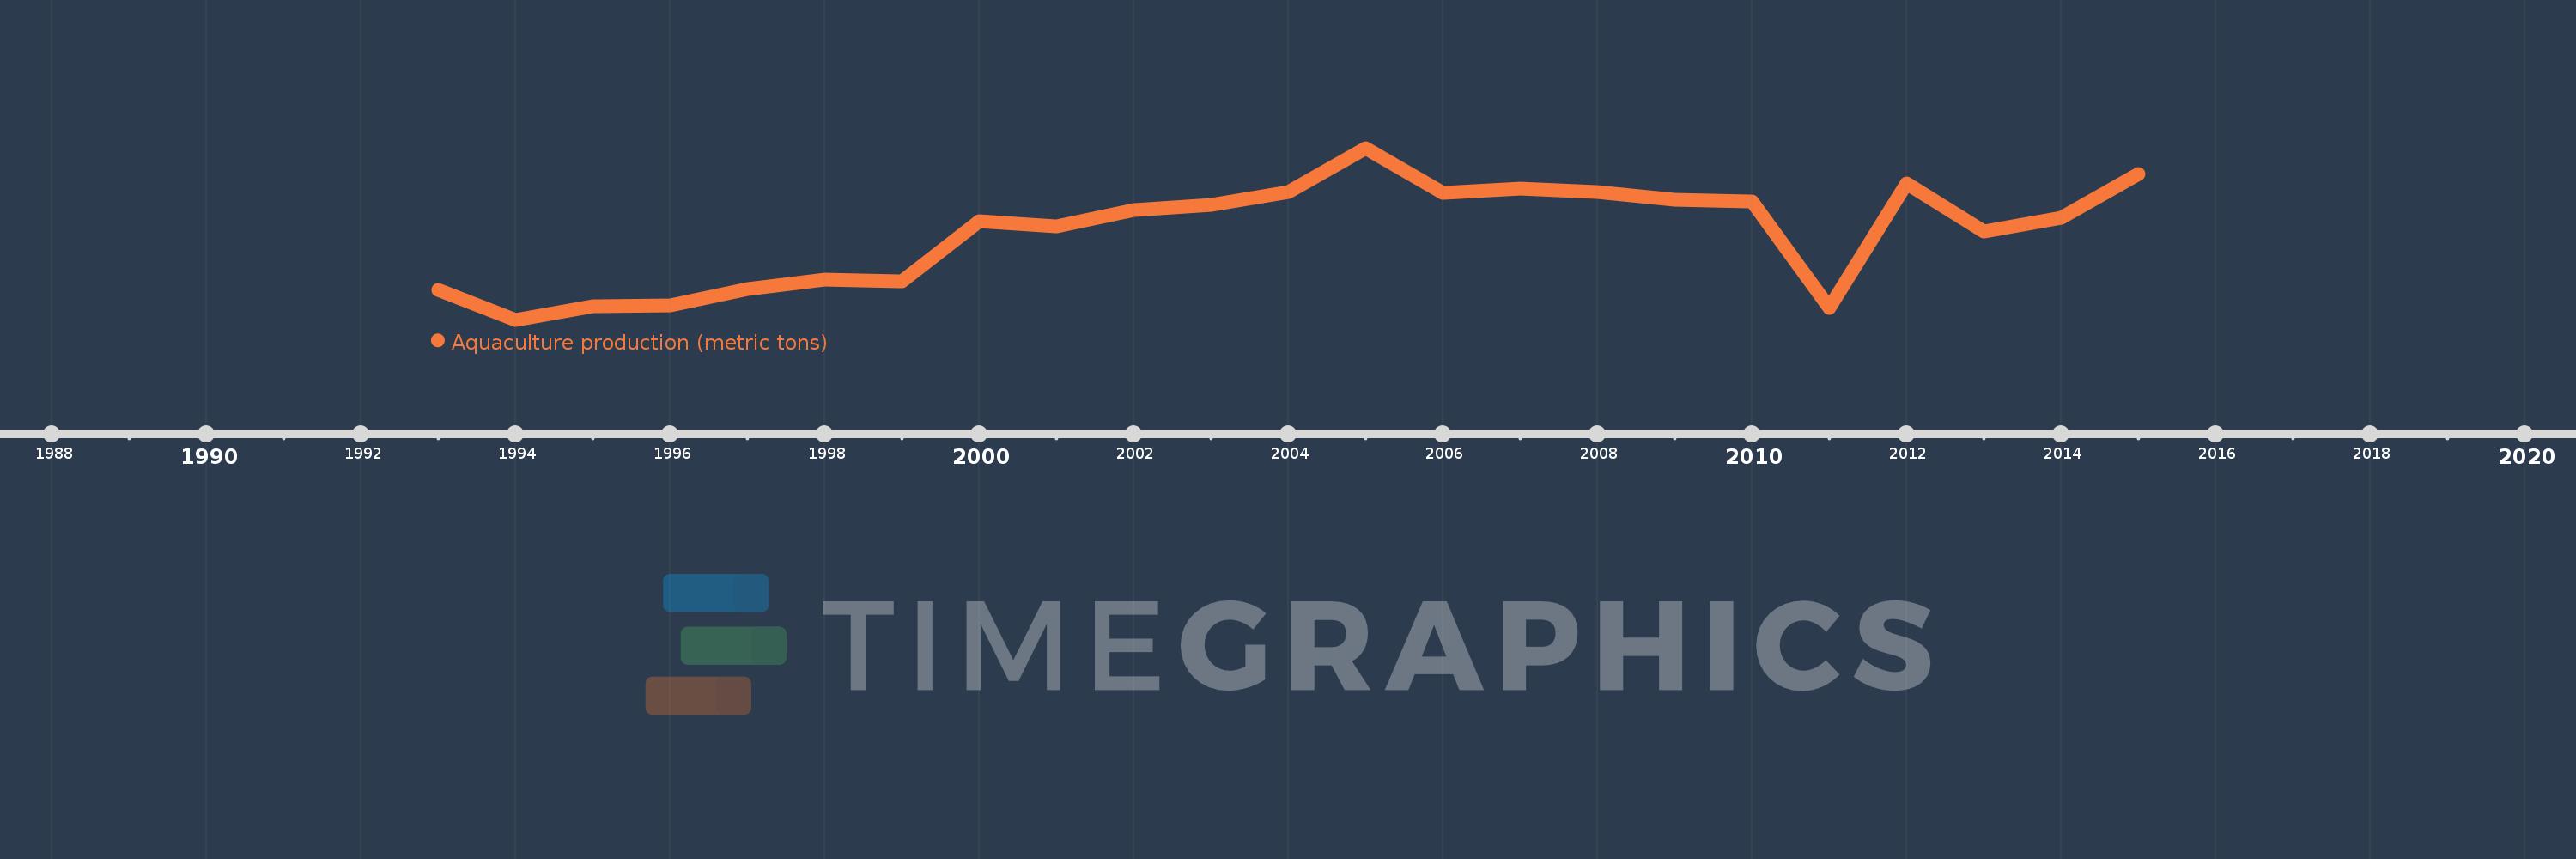
Diese Zeitleiste vorliegt die Graphik ab 1993 J. bis 2015 J. Slovenia. Die Angaben bis 1992 J. sind nicht vorhanden. Die Zahl aktueller Beobachtungen nach Daten: 23.

Die Quelle (Bezeichnung):

Kennzahlen der Weltentwicklung

Die Quelle (Einrichtung):

Food and Agriculture Organization.

Kategorien:

Environment

Es wurde aktualisiert:

23 Apr 2017 Jahr

Kennzahlen der Wertänderungen vom Jahr zum Jahr

im Durchschnitt:
1.148 Tsnd.
Minimum:
718.0
1 Jan 1994 Jahr
Maximum:
1.571 Tsnd.
1 Jan 2005 Jahr
Zum Datum der Beobachtung
Wert
Absolute Veränderung
Die Veränderung bezüglich dem vorherigen Wert
1 Jan 1993 Jahr
868.0
+868.0
0.0%
1 Jan 1994 Jahr
718.0
-150.0
-17.28%
1 Jan 1995 Jahr
787.0
+69.0
9.61%
1 Jan 1996 Jahr
789.0
+2.0
0.25%
1 Jan 1997 Jahr
869.0
+80.0
10.14%
1 Jan 1998 Jahr
917.0
+48.0
5.52%
1 Jan 1999 Jahr
909.0
-8.0
-0.87%
1 Jan 2000 Jahr
1.206 Tsnd.
+297.0
32.67%
1 Jan 2001 Jahr
1.181 Tsnd.
-25.0
-2.07%
1 Jan 2002 Jahr
1.262 Tsnd.
+81.0
6.86%
1 Jan 2003 Jahr
1.289 Tsnd.
+27.0
2.14%
1 Jan 2004 Jahr
1.353 Tsnd.
+64.0
4.97%
1 Jan 2005 Jahr
1.571 Tsnd.
+218.0
16.11%
1 Jan 2006 Jahr
1.346 Tsnd.
-225.0
-14.32%
1 Jan 2007 Jahr
1.369 Tsnd.
+23.0
1.71%
1 Jan 2008 Jahr
1.352 Tsnd.
-17.0
-1.24%
1 Jan 2009 Jahr
1.315 Tsnd.
-37.0
-2.74%
1 Jan 2010 Jahr
1.307 Tsnd.
-8.4
-0.64%
1 Jan 2011 Jahr
778.4
-528.2
-40.43%
1 Jan 2012 Jahr
1.397 Tsnd.
+618.2
79.42%
1 Jan 2013 Jahr
1.154 Tsnd.
-242.3
-17.35%
1 Jan 2014 Jahr
1.226 Tsnd.
+71.4
6.19%
1 Jan 2015 Jahr
1.442 Tsnd.
+216.4
17.66%

Bewertung der Länder gemäß mit laufender Statistik nach Jahren