29
/de/
de
AIzaSyAYiBZKx7MnpbEhh9jyipgxe19OcubqV5w
April 1, 2024
240620
Singapore
SGP
true
2
1
Labor force with secondary education (% of total)
2014,2013,2012,2011,2010,2009,2008,2007,2005,2004,2003,2002,2000,1999,1998,1997,1995,1994,1993,1992
Download
Bibliothek der Globalstatistik →Singapore →

Labor force with secondary education (% of total)

Diese Statistik in anderen Ländern:
AlbaniaAlgeriaAntigua and BarbudaArgentinaArmeniaArubaAustraliaAustriaAzerbaijanBahamas, TheBahrainBarbadosBelarusBelgiumBelizeBermudaBoliviaBosnia and HerzegovinaBotswanaBrazilBritish Virgin IslandsBulgariaCambodiaCanadaCayman IslandsCentral Europe and the BalticsChadChileColombiaCosta RicaCroatiaCubaCyprusCzech RepublicDenmarkDominicaDominican RepublicEarly-demographic dividendEcuadorEgypt, Arab Rep.El SalvadorEstoniaEthiopiaEuro areaEurope & Central AsiaEurope & Central Asia (excluding high income)Europe & Central Asia (IDA & IBRD countries)European UnionFinlandFranceFrench PolynesiaGeorgiaGermanyGhanaGreeceGuatemalaGuyanaHigh incomeHondurasHong Kong SAR, ChinaHungaryIcelandIndiaIndonesiaIran, Islamic Rep.IrelandIsraelItalyJapanJordanKazakhstanKorea, Rep.KosovoKuwaitKyrgyz RepublicLatin America & Caribbean Latin America & Caribbean (excluding high income)Latin America & the Caribbean (IDA & IBRD countries)LatviaLebanonLithuaniaLuxembourgMacao SAR, ChinaMacedonia, FYRMadagascarMalaysiaMaltaMauritiusMexicoMoldovaMongoliaMontenegroMoroccoNamibiaNepalNetherlandsNew CaledoniaNew ZealandNicaraguaNigerNigeriaNorth AmericaNorwayOECD membersOmanPakistanPanamaParaguayPeruPhilippinesPolandPortugalPost-demographic dividendRomaniaRussian FederationRwandaSan MarinoSaudi ArabiaSerbiaSingaporeSlovak RepublicSloveniaSouth AfricaSouth AsiaSouth Asia (IDA & IBRD)SpainSri LankaSt. Kitts and NevisSt. LuciaSt. Vincent and the GrenadinesSwedenSwitzerlandSyrian Arab RepublicTajikistanThailandTimor-LesteTrinidad and TobagoTunisiaTurkeyUgandaUkraineUnited Arab EmiratesUnited KingdomUnited StatesUruguayVenezuela, RBWest Bank and GazaYemen, Rep.
Zeitlinie:
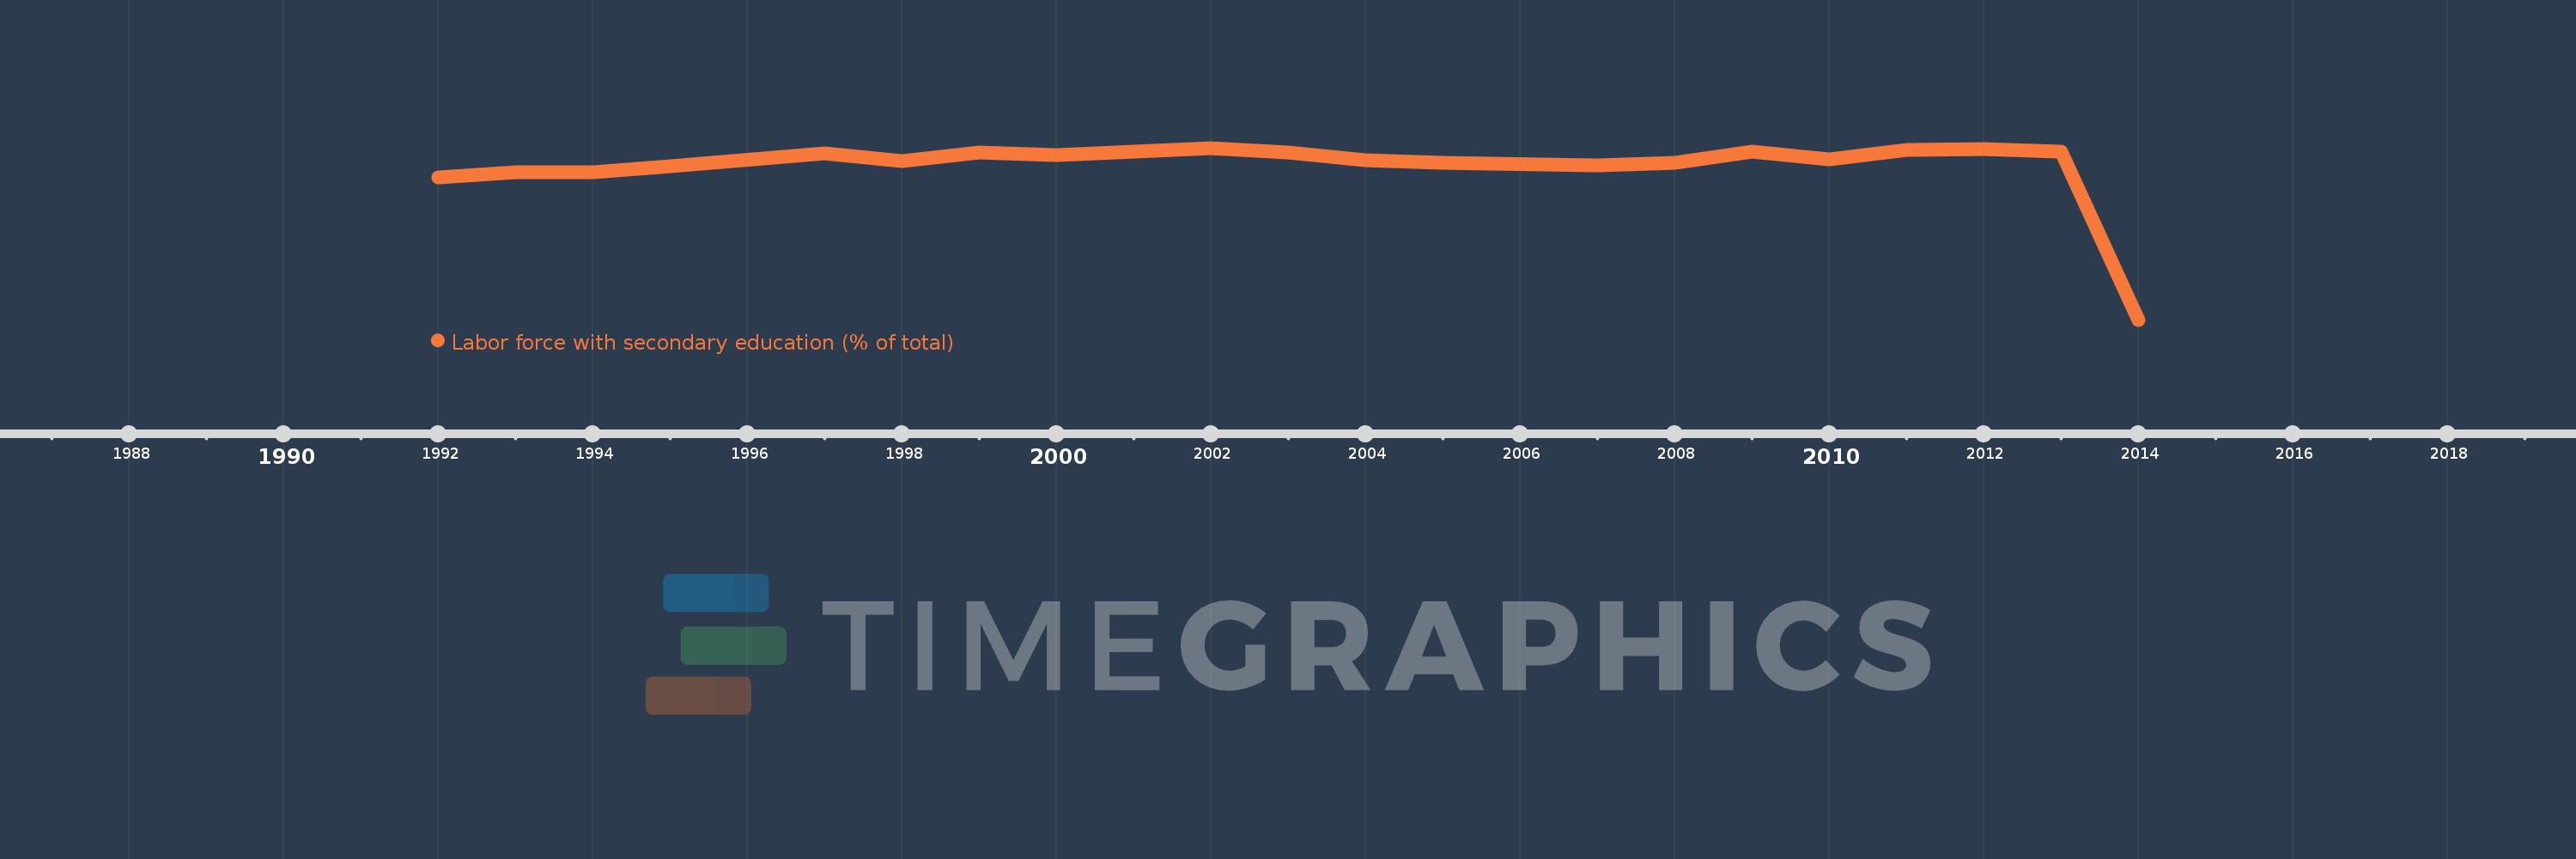
Diese Zeitleiste vorliegt die Graphik ab 1992 J. bis 2014 J. Singapore. Die Angaben bis 1991 J. sind nicht vorhanden. Die Zahl aktueller Beobachtungen nach Daten: 20.
Die Quelle (Bezeichnung):
Kennzahlen der Weltentwicklung
Die Quelle (Einrichtung):
International Labour Organization, Key Indicators of the Labour Market database.
Kategorien:
Education, Social Protection & Labor
Es wurde aktualisiert:
23 Apr 2017 Jahr
Kennzahlen der Wertänderungen vom Jahr zum Jahr
im Durchschnitt:
48.09
Minimum:
30.3
1 Jan 2014 Jahr
Maximum:
50.3
1 Jan 2002 Jahr
Zum Datum der Beobachtung
Wert
Absolute Veränderung
Die Veränderung bezüglich dem vorherigen Wert
1 Jan 1992 Jahr
46.9
+46.9
0.0%
1 Jan 1993 Jahr
47.5
+0.6
1.28%
1 Jan 1994 Jahr
47.5
0.0
0.0%
1 Jan 1995 Jahr
48.2
+0.7
1.47%
1 Jan 1997 Jahr
49.7
+1.5
3.11%
1 Jan 1998 Jahr
48.8
-0.9
-1.81%
1 Jan 1999 Jahr
49.8
+1.0
2.05%
1 Jan 2000 Jahr
49.5
-0.3
-0.6%
1 Jan 2002 Jahr
50.3
+0.8
1.62%
1 Jan 2003 Jahr
49.8
-0.5
-0.99%
1 Jan 2004 Jahr
48.9
-0.9
-1.81%
1 Jan 2005 Jahr
48.6
-0.3
-0.61%
1 Jan 2007 Jahr
48.3
-0.3
-0.62%
1 Jan 2008 Jahr
48.6
+0.3
0.62%
1 Jan 2009 Jahr
49.9
+1.3
2.67%
1 Jan 2010 Jahr
49.0
-0.9
-1.8%
1 Jan 2011 Jahr
50.1
+1.1
2.24%
1 Jan 2012 Jahr
50.2
+0.1
0.2%
1 Jan 2013 Jahr
49.9
-0.3
-0.6%
1 Jan 2014 Jahr
30.3
-19.6
-39.28%
Bewertung der Länder gemäß mit laufender Statistik nach Jahren

Kommentare:

Abschicken
PremiumAbout & FeedbackVereinbarungPrivatheit
logo
© 2022 Selected Technologies LLC – Morgan Hill, California