33
/de/
AIzaSyAYiBZKx7MnpbEhh9jyipgxe19OcubqV5w
August 1, 2025
237436
Serbia
SRB
true
2
1
Net bilateral aid flows from DAC donors, Canada (current US$)
2015,2014,2012,2011,2010,2009,2008,2007,2006,2005,2004,2002,2000,1999,1998,1996
Download
Bibliothek der Globalstatistik →Serbia →

Net bilateral aid flows from DAC donors, Canada (current US$)

Diese Statistik in anderen Ländern:

AfghanistanAlbaniaAlgeriaAngolaAntigua and BarbudaArab WorldArgentinaArmeniaAzerbaijanBahamas, TheBangladeshBarbadosBelarusBelizeBeninBermudaBhutanBoliviaBosnia and HerzegovinaBotswanaBrazilBritish Virgin IslandsBrunei DarussalamBulgariaBurkina FasoBurundiCabo VerdeCambodiaCameroonCaribbean small statesCayman IslandsCentral African RepublicCentral Europe and the BalticsChadChileChinaColombiaComorosCongo, Dem. Rep.Congo, Rep.Costa RicaCote d'IvoireCroatiaCubaCyprusCzech RepublicDjiboutiDominicaDominican RepublicEast Asia & PacificEast Asia & Pacific (excluding high income)East Asia & Pacific (IDA & IBRD countries)EcuadorEgypt, Arab Rep.El SalvadorEquatorial GuineaEritreaEstoniaEthiopiaEuro areaEurope & Central AsiaEurope & Central Asia (excluding high income)Europe & Central Asia (IDA & IBRD countries)European UnionFijiFragile and conflict affected situationsGabonGambia, TheGeorgiaGhanaGrenadaGuatemalaGuineaGuinea-BissauGuyanaHaitiHeavily indebted poor countries (HIPC)High incomeHondurasHong Kong SAR, ChinaHungaryIBRD onlyIDA & IBRD totalIDA blendIDA onlyIDA totalIndiaIndonesiaIran, Islamic Rep.IraqIsraelJamaicaJordanKazakhstanKenyaKiribatiKorea, Dem. People’s Rep.Korea, Rep.KosovoKyrgyz RepublicLao PDRLatin America & Caribbean Latin America & Caribbean (excluding high income)Latin America & the Caribbean (IDA & IBRD countries)LatviaLeast developed countries: UN classificationLebanonLesothoLiberiaLibyaLithuaniaLow & middle incomeLow incomeLower middle incomeMacedonia, FYRMadagascarMalawiMalaysiaMaldivesMaliMaltaMarshall IslandsMauritaniaMauritiusMexicoMicronesia, Fed. Sts.Middle East & North AfricaMiddle East & North Africa (excluding high income)Middle East & North Africa (IDA & IBRD countries)Middle incomeMoldovaMongoliaMontenegroMoroccoMozambiqueMyanmarNamibiaNauruNepalNew CaledoniaNicaraguaNigerNigeriaNorth AmericaNorthern Mariana IslandsOECD membersOther small statesPacific island small statesPakistanPalauPanamaPapua New GuineaParaguayPeruPhilippinesPolandRomaniaRussian FederationRwandaSamoaSao Tome and PrincipeSaudi ArabiaSenegalSerbiaSeychellesSierra LeoneSingaporeSlovak RepublicSloveniaSmall statesSolomon IslandsSomaliaSouth AfricaSouth AsiaSouth Asia (IDA & IBRD)South SudanSri LankaSt. Kitts and NevisSt. LuciaSt. Vincent and the GrenadinesSub-Saharan Africa Sub-Saharan Africa (excluding high income)Sub-Saharan Africa (IDA & IBRD countries)SudanSurinameSwazilandSyrian Arab RepublicTajikistanTanzaniaThailandTimor-LesteTogoTongaTrinidad and TobagoTunisiaTurkeyTurkmenistanTurks and Caicos IslandsTuvaluUgandaUkraineUpper middle incomeUruguayUzbekistanVanuatuVenezuela, RBVietnamWest Bank and GazaWorldYemen, Rep.ZambiaZimbabwe

Zeitlinie:

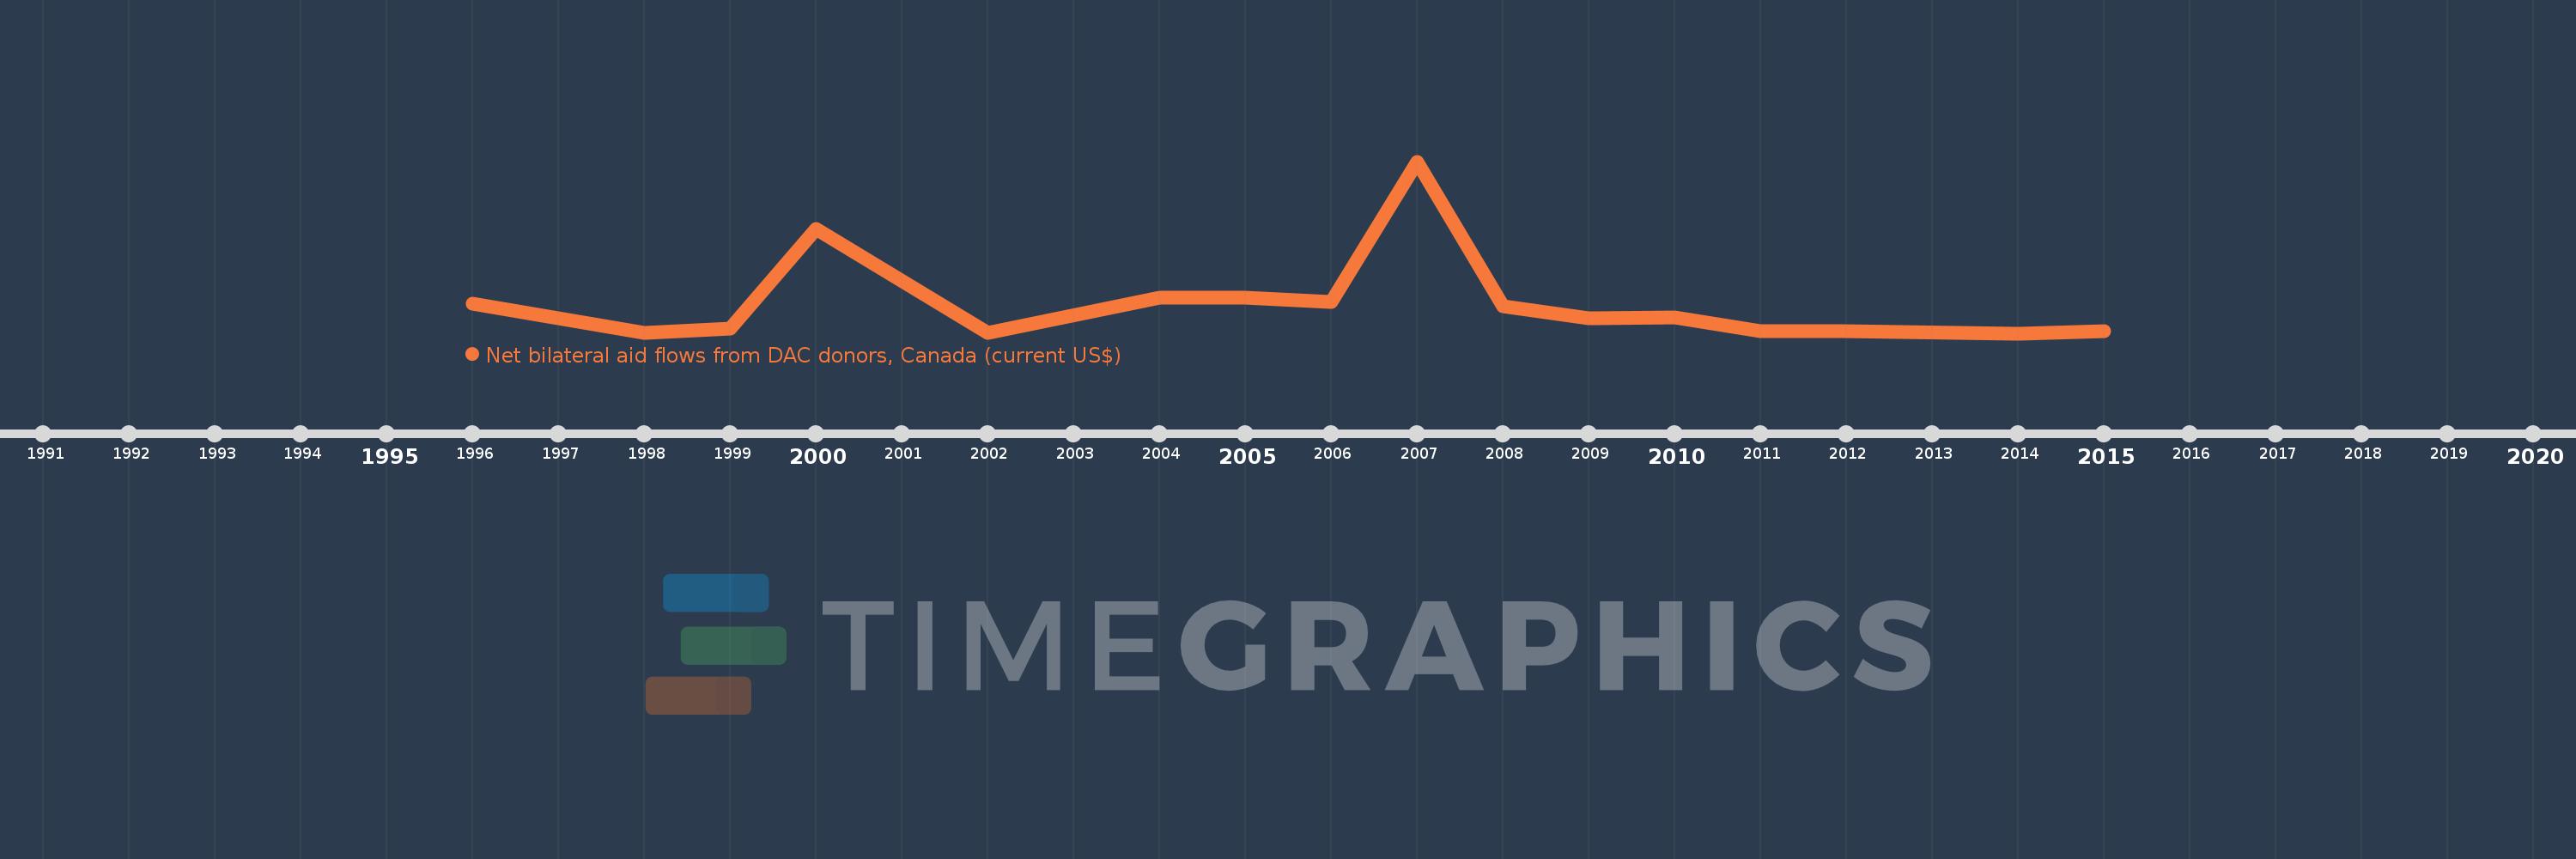
Diese Zeitleiste vorliegt die Graphik ab 1996 J. bis 2015 J. Serbia. Die Angaben bis 1995 J. sind nicht vorhanden. Die Zahl aktueller Beobachtungen nach Daten: 16.

Die Quelle (Bezeichnung):

Kennzahlen der Weltentwicklung

Die Quelle (Einrichtung):

Development Assistance Committee of the Organisation for Economic Co-operation and Development, Geographical Distribution of Financial Flows to Developing Countries, Development Co-operation Report, and International Development Statistics database. Data are available online at: www.oecd.org/dac/stats/idsonline.

Kategorien:

Aid Effectiveness

Es wurde aktualisiert:

23 Apr 2017 Jahr

Kennzahlen der Wertänderungen vom Jahr zum Jahr

im Durchschnitt:
8.783 Mln.
Minimum:
100.0 Tsnd.
1 Jan 2014 Jahr
Maximum:
49.92 Mln.
1 Jan 2007 Jahr
Zum Datum der Beobachtung
Wert
Absolute Veränderung
Die Veränderung bezüglich dem vorherigen Wert
1 Jan 1996 Jahr
8.74 Mln.
+8.74 Mln.
0.0%
1 Jan 1998 Jahr
160.0 Tsnd.
-8.58 Mln.
-98.17%
1 Jan 1999 Jahr
1.51 Mln.
+1.35 Mln.
843.75%
1 Jan 2000 Jahr
30.31 Mln.
+28.8 Mln.
1.91 Tsnd.%
1 Jan 2002 Jahr
280.0 Tsnd.
-30.03 Mln.
-99.08%
1 Jan 2004 Jahr
10.54 Mln.
+10.26 Mln.
3.66 Tsnd.%
1 Jan 2005 Jahr
10.42 Mln.
-120.0 Tsnd.
-1.14%
1 Jan 2006 Jahr
9.2 Mln.
-1.22 Mln.
-11.71%
1 Jan 2007 Jahr
49.92 Mln.
+40.72 Mln.
442.61%
1 Jan 2008 Jahr
7.96 Mln.
-41.96 Mln.
-84.05%
1 Jan 2009 Jahr
4.51 Mln.
-3.45 Mln.
-43.34%
1 Jan 2010 Jahr
4.79 Mln.
+280.0 Tsnd.
6.21%
1 Jan 2011 Jahr
770.0 Tsnd.
-4.02 Mln.
-83.92%
1 Jan 2012 Jahr
640.0 Tsnd.
-130.0 Tsnd.
-16.88%
1 Jan 2014 Jahr
100.0 Tsnd.
-540.0 Tsnd.
-84.38%
1 Jan 2015 Jahr
680.0 Tsnd.
+580.0 Tsnd.
580.0%

Bewertung der Länder gemäß mit laufender Statistik nach Jahren