29
/de/
de
AIzaSyAYiBZKx7MnpbEhh9jyipgxe19OcubqV5w
April 1, 2024
233406
Sao Tome and Principe
STP
true
2
1
Borrowers from commercial banks (per 1,000 adults)
2016,2015,2014
Download
Bibliothek der Globalstatistik →Sao Tome and Principe →

Borrowers from commercial banks (per 1,000 adults)

Diese Statistik in anderen Ländern:
AfghanistanAlbaniaAlgeriaAngolaArab WorldArgentinaAzerbaijanBangladeshBelgiumBelizeBoliviaBosnia and HerzegovinaBotswanaBrazilBrunei DarussalamBurundiCabo VerdeCameroonCentral African RepublicCentral Europe and the BalticsChadChileChinaColombiaComorosCongo, Dem. Rep.Congo, Rep.Costa RicaCroatiaDjiboutiDominican RepublicEarly-demographic dividendEast Asia & Pacific (excluding high income)East Asia & Pacific (IDA & IBRD countries)EcuadorEgypt, Arab Rep.El SalvadorEquatorial GuineaEstoniaEthiopiaEurope & Central Asia (excluding high income)Europe & Central Asia (IDA & IBRD countries)Fragile and conflict affected situationsGabonGeorgiaGhanaGuatemalaGuineaHaitiHeavily indebted poor countries (HIPC)HondurasHungaryIBRD onlyIDA & IBRD totalIDA blendIDA onlyIDA totalIndonesiaIsraelItalyKenyaKiribatiKosovoKuwaitKyrgyz RepublicLao PDRLate-demographic dividendLatin America & Caribbean Latin America & Caribbean (excluding high income)Latin America & the Caribbean (IDA & IBRD countries)LatviaLeast developed countries: UN classificationLebanonLesothoLiberiaLibyaLow & middle incomeLow incomeLower middle incomeMacedonia, FYRMadagascarMalawiMalaysiaMaldivesMauritaniaMiddle East & North AfricaMiddle East & North Africa (excluding high income)Middle East & North Africa (IDA & IBRD countries)Middle incomeMoldovaMontenegroMozambiqueMyanmarNamibiaNigeriaOther small statesPakistanPalauParaguayPeruPolandPortugalPre-demographic dividendQatarRomaniaRwandaSamoaSan MarinoSao Tome and PrincipeSaudi ArabiaSerbiaSeychellesSierra LeoneSingaporeSmall statesSolomon IslandsSouth AsiaSouth Asia (IDA & IBRD)South SudanSub-Saharan Africa Sub-Saharan Africa (excluding high income)Sub-Saharan Africa (IDA & IBRD countries)SurinameSwazilandSyrian Arab RepublicTajikistanTanzaniaThailandTimor-LesteTunisiaTurkeyUgandaUnited KingdomUpper middle incomeUruguayUzbekistanVanuatuWest Bank and GazaWorldYemen, Rep.ZambiaZimbabwe
Zeitlinie:
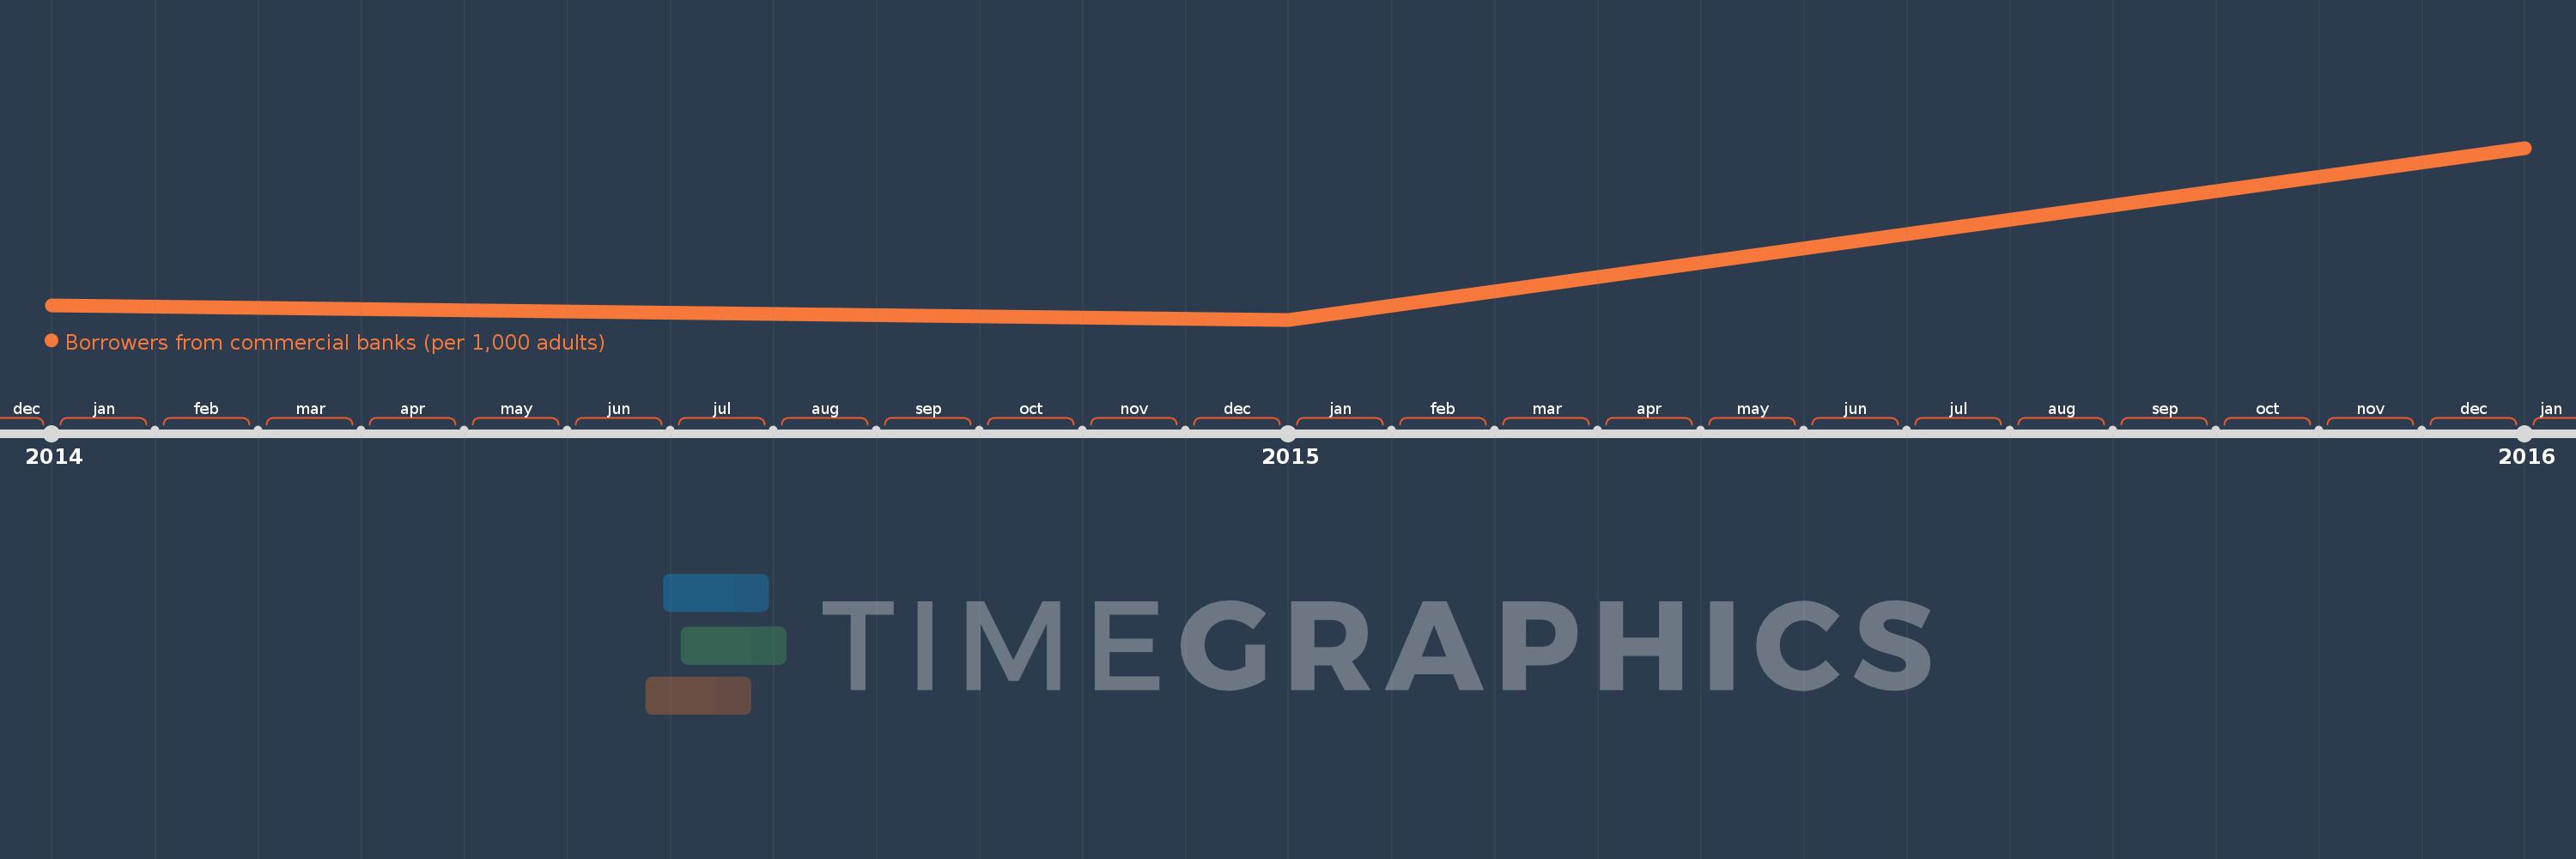
Diese Zeitleiste vorliegt die Graphik ab 2014 J. bis 2016 J. Sao Tome and Principe. Die Angaben bis 2013 J. sind nicht vorhanden. Die Zahl aktueller Beobachtungen nach Daten: 3.
Die Quelle (Bezeichnung):
Kennzahlen der Weltentwicklung
Die Quelle (Einrichtung):
International Monetary Fund, Financial Access Survey.
Kategorien:
Financial Sector
Es wurde aktualisiert:
23 Apr 2017 Jahr
Kennzahlen der Wertänderungen vom Jahr zum Jahr
im Durchschnitt:
83.976
Minimum:
63.359
1 Jan 2015 Jahr
Maximum:
120.544
1 Jan 2016 Jahr
Zum Datum der Beobachtung
Wert
Absolute Veränderung
Die Veränderung bezüglich dem vorherigen Wert
1 Jan 2014 Jahr
68.027
+68.027
0.0%
1 Jan 2015 Jahr
63.359
-4.668
-6.86%
1 Jan 2016 Jahr
120.544
+57.185
90.26%
Bewertung der Länder gemäß mit laufender Statistik nach Jahren

Kommentare:

Abschicken
PremiumAbout & FeedbackVereinbarungPrivatheit
logo
© 2022 Selected Technologies LLC – Morgan Hill, California