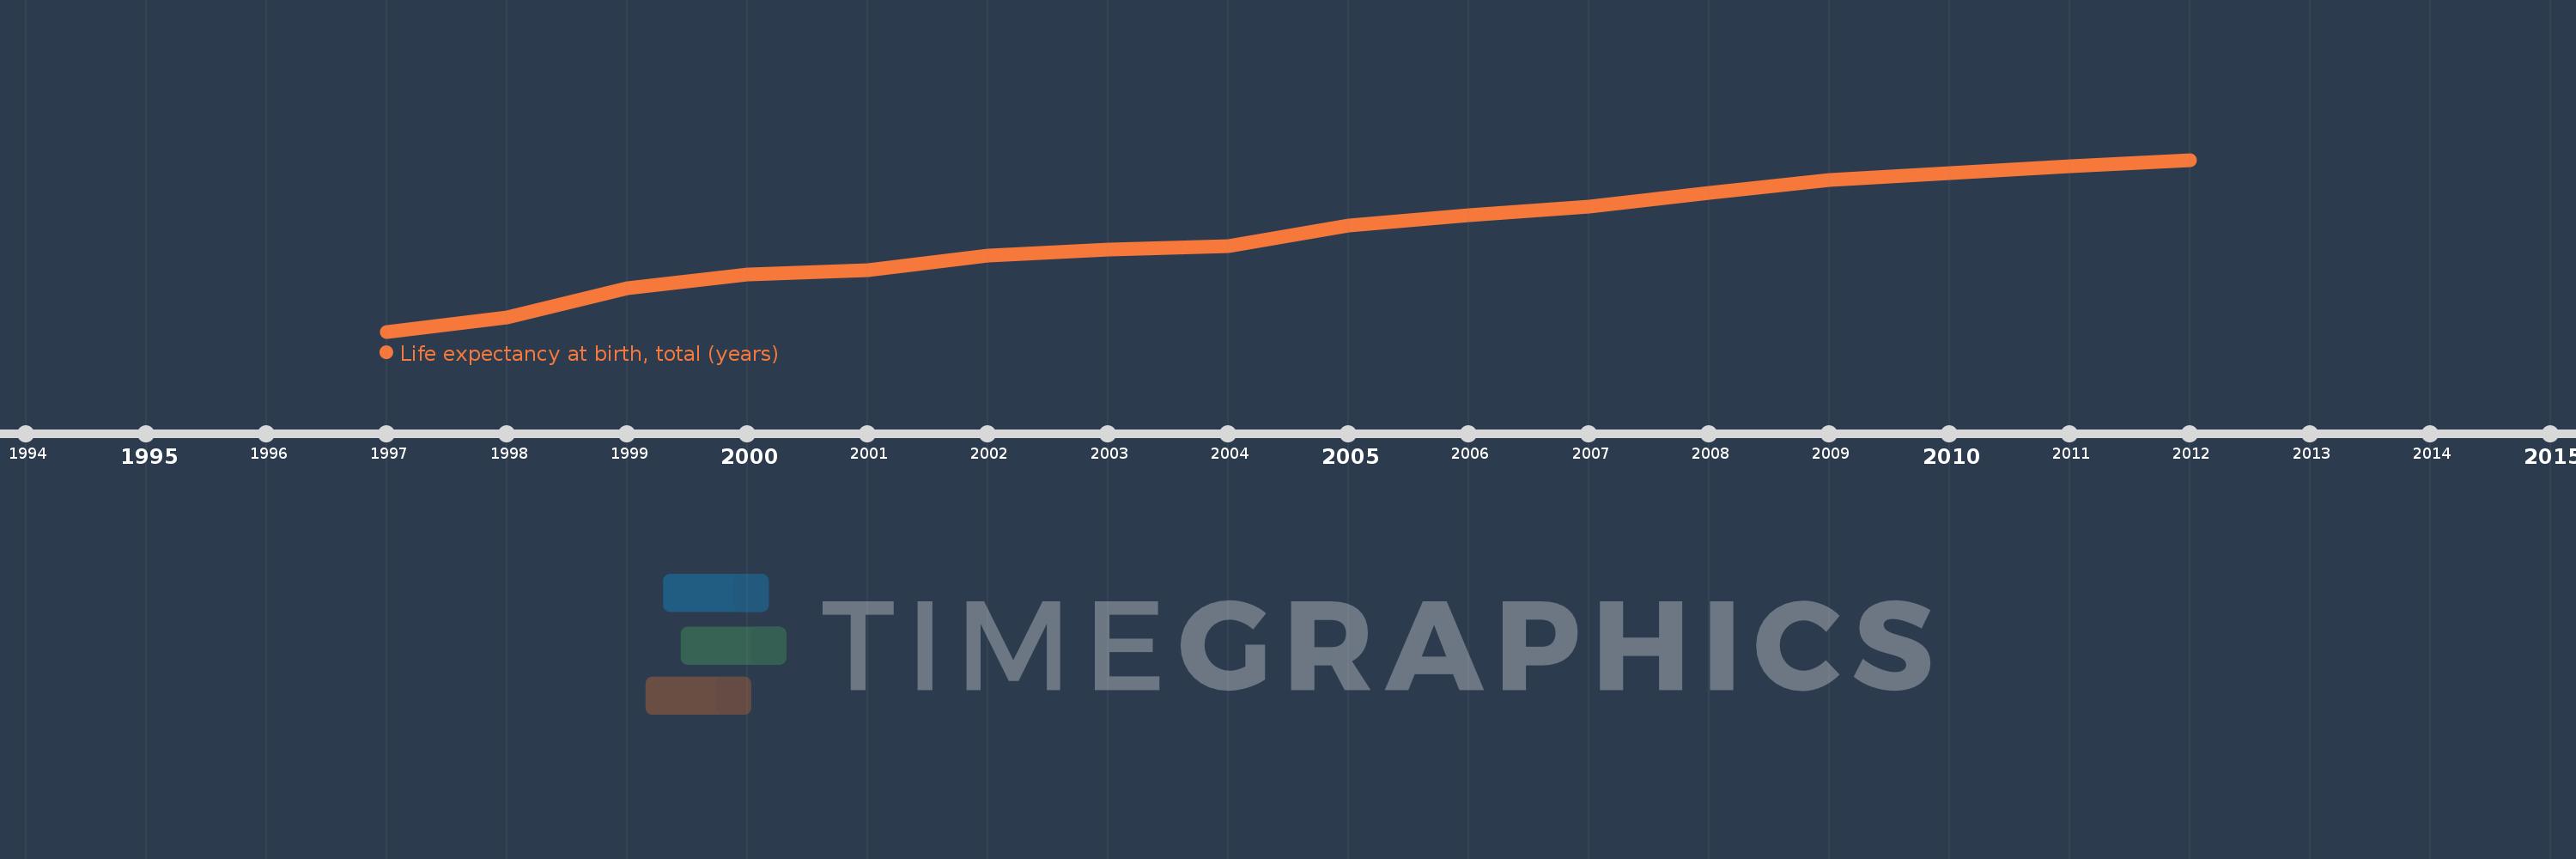
Diese Zeitleiste vorliegt die Graphik ab 1997 J. bis 2012 J. San Marino. Die Angaben bis 1996 J. sind nicht vorhanden. Die Zahl aktueller Beobachtungen nach Daten: 16.
Die Quelle (Bezeichnung):
Kennzahlen der Weltentwicklung
Die Quelle (Einrichtung):
Derived from male and female life expectancy at birth from sources such as: (1) United Nations Population Division. World Population Prospects, (2) Census reports and other statistical publications from national statistical offices, (3) Eurostat: Demographic Statistics, (4) United Nations Statistical Division. Population and Vital Statistics Reprot (various years), (5) U.S. Census Bureau: International Database, and (6) Secretariat of the Pacific Community: Statistics and Demography Programme.
Kategorien:
Health
Es wurde aktualisiert:
23 Apr 2017 Jahr
Kennzahlen der Wertänderungen vom Jahr zum Jahr
im Durchschnitt:
81.495
Minimum:
79.12
1 Jan 1997 Jahr
Maximum:
83.323
1 Jan 2012 Jahr
Zum Datum der Beobachtung
Wert
Absolute Veränderung
Die Veränderung bezüglich dem vorherigen Wert
1 Jan 1997 Jahr
79.12
+79.12
0.0%
1 Jan 1998 Jahr
79.473
+0.354
0.45%
1 Jan 1999 Jahr
80.173
+0.7
0.88%
1 Jan 2000 Jahr
80.524
+0.351
0.44%
1 Jan 2001 Jahr
80.62
+0.095
0.12%
1 Jan 2002 Jahr
80.973
+0.354
0.44%
1 Jan 2003 Jahr
81.12
+0.146
0.18%
1 Jan 2004 Jahr
81.22
+0.1
0.12%
1 Jan 2005 Jahr
81.722
+0.502
0.62%
1 Jan 2006 Jahr
81.976
+0.254
0.31%
1 Jan 2007 Jahr
82.18
+0.205
0.25%
1 Jan 2008 Jahr
82.506
+0.326
0.4%
1 Jan 2009 Jahr
82.832
+0.326
0.39%
1 Jan 2010 Jahr
82.996
+0.164
0.2%
1 Jan 2011 Jahr
83.159
+0.164
0.2%
1 Jan 2012 Jahr
83.323
+0.164
0.2%
Bewertung der Länder gemäß mit laufender Statistik nach Jahren