33
/de/
AIzaSyB4mHJ5NPEv-XzF7P6NDYXjlkCWaeKw5bc
November 30, 2025
232757
Samoa
WSM
true
2
1
Renewable energy consumption (% of total final energy consumption)
2012,2011,2010,2009,2008,2007,2006,2005,2004,2003,2002,2001,2000,1996,1995,1994,1993,1992,1991
Create a timeline
Public Timelines
For education
For educational institutions
For teachers
For students
Cabinet
For educational institutions
For teachers
For students
Open cabinet
FAQ
Close
Create a timeline
Public timelines
FAQ
About & Feedback
Vereinbarung
Privatheit
FAQ
Support 24/7
Cabinet
Get premium
Donate
Download
Bibliothek der Globalstatistik
→
Samoa
→
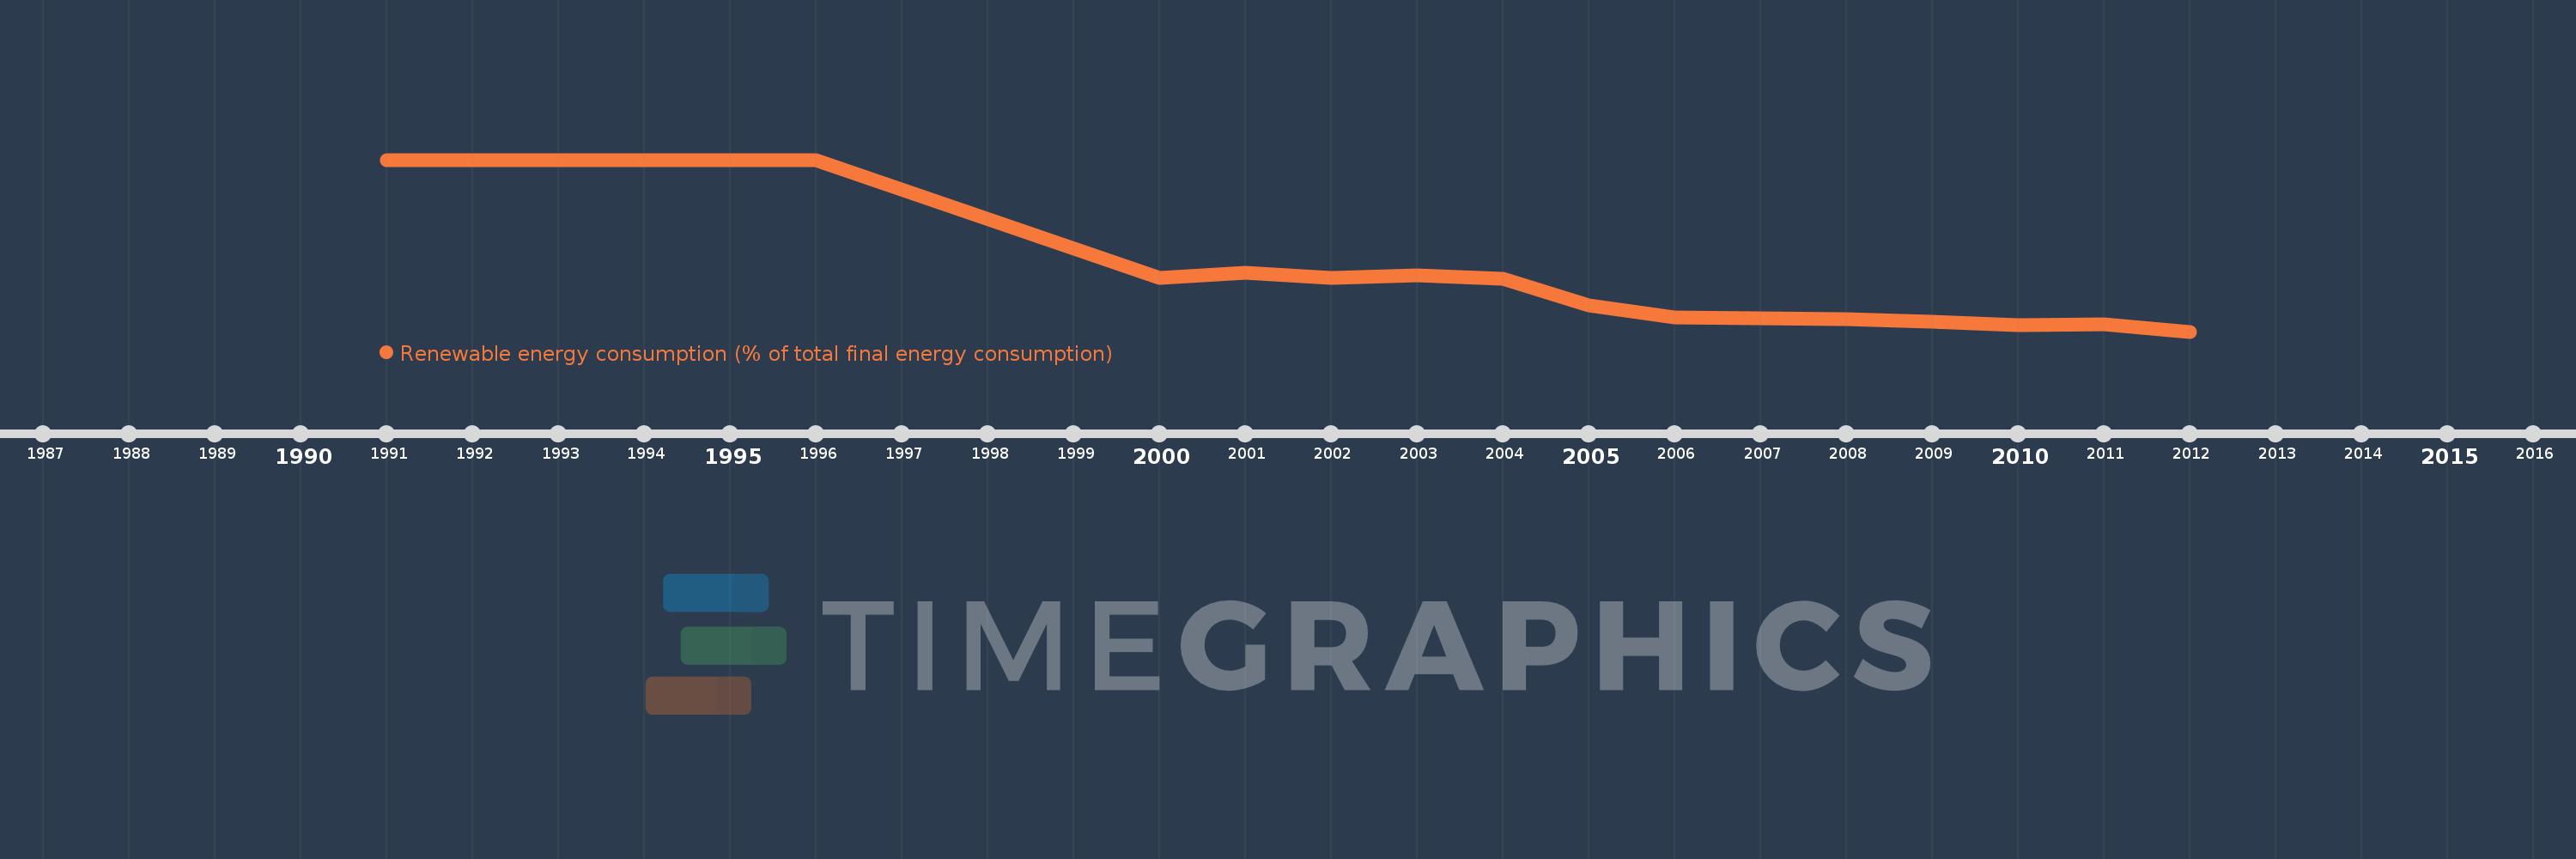
Renewable energy consumption (% of total final energy consumption)
Diese Statistik in anderen Ländern:
Afghanistan
Albania
Algeria
Angola
Arab World
Argentina
Armenia
Aruba
Australia
Austria
Azerbaijan
Bahamas, The
Bangladesh
Barbados
Belarus
Belgium
Belize
Benin
Bhutan
Bolivia
Bosnia and Herzegovina
Botswana
Brazil
British Virgin Islands
Brunei Darussalam
Bulgaria
Burkina Faso
Burundi
Cabo Verde
Cambodia
Cameroon
Canada
Caribbean small states
Central African Republic
Central Europe and the Baltics
Chad
Chile
China
Colombia
Comoros
Congo, Dem. Rep.
Congo, Rep.
Costa Rica
Cote d'Ivoire
Croatia
Cuba
Cyprus
Czech Republic
Denmark
Djibouti
Dominica
Dominican Republic
Early-demographic dividend
East Asia & Pacific
East Asia & Pacific (excluding high income)
East Asia & Pacific (IDA & IBRD countries)
Ecuador
Egypt, Arab Rep.
El Salvador
Equatorial Guinea
Eritrea
Estonia
Ethiopia
Euro area
Europe & Central Asia
Europe & Central Asia (excluding high income)
Europe & Central Asia (IDA & IBRD countries)
European Union
Fiji
Finland
Fragile and conflict affected situations
France
French Polynesia
Gabon
Gambia, The
Georgia
Germany
Ghana
Greece
Grenada
Guatemala
Guinea
Guinea-Bissau
Guyana
Haiti
Heavily indebted poor countries (HIPC)
High income
Honduras
Hong Kong SAR, China
Hungary
IBRD only
Iceland
IDA & IBRD total
IDA blend
IDA only
IDA total
India
Indonesia
Iran, Islamic Rep.
Iraq
Ireland
Israel
Italy
Jamaica
Japan
Jordan
Kazakhstan
Kenya
Kiribati
Korea, Dem. People’s Rep.
Korea, Rep.
Kosovo
Kuwait
Kyrgyz Republic
Lao PDR
Late-demographic dividend
Latin America & Caribbean
Latin America & Caribbean (excluding high income)
Latin America & the Caribbean (IDA & IBRD countries)
Latvia
Least developed countries: UN classification
Lebanon
Lesotho
Liberia
Libya
Lithuania
Low & middle income
Low income
Lower middle income
Luxembourg
Macao SAR, China
Macedonia, FYR
Madagascar
Malawi
Malaysia
Maldives
Mali
Malta
Mauritania
Mauritius
Mexico
Middle East & North Africa
Middle East & North Africa (excluding high income)
Middle East & North Africa (IDA & IBRD countries)
Middle income
Moldova
Mongolia
Montenegro
Morocco
Mozambique
Myanmar
Namibia
Nepal
Netherlands
New Caledonia
New Zealand
Nicaragua
Niger
Nigeria
North America
Norway
OECD members
Other small states
Pacific island small states
Pakistan
Palau
Panama
Papua New Guinea
Paraguay
Peru
Philippines
Poland
Portugal
Post-demographic dividend
Pre-demographic dividend
Puerto Rico
Romania
Russian Federation
Rwanda
Samoa
Sao Tome and Principe
Saudi Arabia
Senegal
Serbia
Seychelles
Sierra Leone
Singapore
Slovak Republic
Slovenia
Small states
Solomon Islands
Somalia
South Africa
South Asia
South Asia (IDA & IBRD)
Spain
Sri Lanka
St. Kitts and Nevis
St. Lucia
St. Vincent and the Grenadines
Sub-Saharan Africa
Sub-Saharan Africa (excluding high income)
Sub-Saharan Africa (IDA & IBRD countries)
Sudan
Suriname
Swaziland
Sweden
Switzerland
Syrian Arab Republic
Tajikistan
Tanzania
Thailand
Timor-Leste
Togo
Tonga
Trinidad and Tobago
Tunisia
Turkey
Turkmenistan
Turks and Caicos Islands
Uganda
Ukraine
United Arab Emirates
United Kingdom
United States
Upper middle income
Uruguay
Uzbekistan
Vanuatu
Venezuela, RB
Vietnam
World
Yemen, Rep.
Zambia
Zimbabwe
Zeitlinie:
Diese Zeitleiste vorliegt die Graphik ab
1991
J. bis
2012
J. Samoa. Die Angaben bis
1990
J. sind nicht vorhanden. Die Zahl aktueller Beobachtungen nach Daten:
19
.
Die Quelle (Bezeichnung):
Kennzahlen der Weltentwicklung
Die Quelle (Einrichtung):
© OECD/IEA and World Bank, based on IEA data in IEA World Energy Balances © OECD/IEA 2013 edition, subject to https://www.iea.org/t&c/termsandconditions/
Kategorien:
Energy & Mining, Climate Change, Environment
Es wurde aktualisiert:
23 Apr 2017 Jahr
Kennzahlen der Wertänderungen vom Jahr zum Jahr
im Durchschnitt:
56.05
Minimum:
23.152
1 Jan 2012 Jahr
Maximum:
100.0
1 Jan 1991 Jahr
Zum Datum der Beobachtung
Wert
Absolute Veränderung
Die Veränderung bezüglich dem vorherigen Wert
1 Jan 1991 Jahr
100.0
+100.0
0.0%
1 Jan 1992 Jahr
100.0
0.0
0.0%
1 Jan 1993 Jahr
100.0
0.0
0.0%
1 Jan 1994 Jahr
100.0
0.0
0.0%
1 Jan 1995 Jahr
100.0
0.0
0.0%
1 Jan 1996 Jahr
100.0
0.0
0.0%
1 Jan 2000 Jahr
47.046
-52.954
-52.95%
1 Jan 2001 Jahr
49.48
+2.434
5.17%
1 Jan 2002 Jahr
47.222
-2.258
-4.56%
1 Jan 2003 Jahr
48.392
+1.17
2.48%
1 Jan 2004 Jahr
46.772
-1.619
-3.35%
1 Jan 2005 Jahr
34.919
-11.853
-25.34%
1 Jan 2006 Jahr
29.62
-5.3
-15.18%
1 Jan 2007 Jahr
29.204
-0.416
-1.4%
1 Jan 2008 Jahr
28.883
-0.32
-1.1%
1 Jan 2009 Jahr
27.656
-1.228
-4.25%
1 Jan 2010 Jahr
26.141
-1.515
-5.48%
1 Jan 2011 Jahr
26.458
+0.317
1.21%
1 Jan 2012 Jahr
23.152
-3.306
-12.49%
Bewertung der Länder gemäß mit laufender Statistik nach Jahren
About & Feedback
Vereinbarung
Privatheit
FAQ
Support 24/7
Cabinet
Get premium
Donate
The service accepts bank transfer (ACH, Wire) or cards (Visa, MasterCard, etc). Processed by Stripe.
Secured with SSL