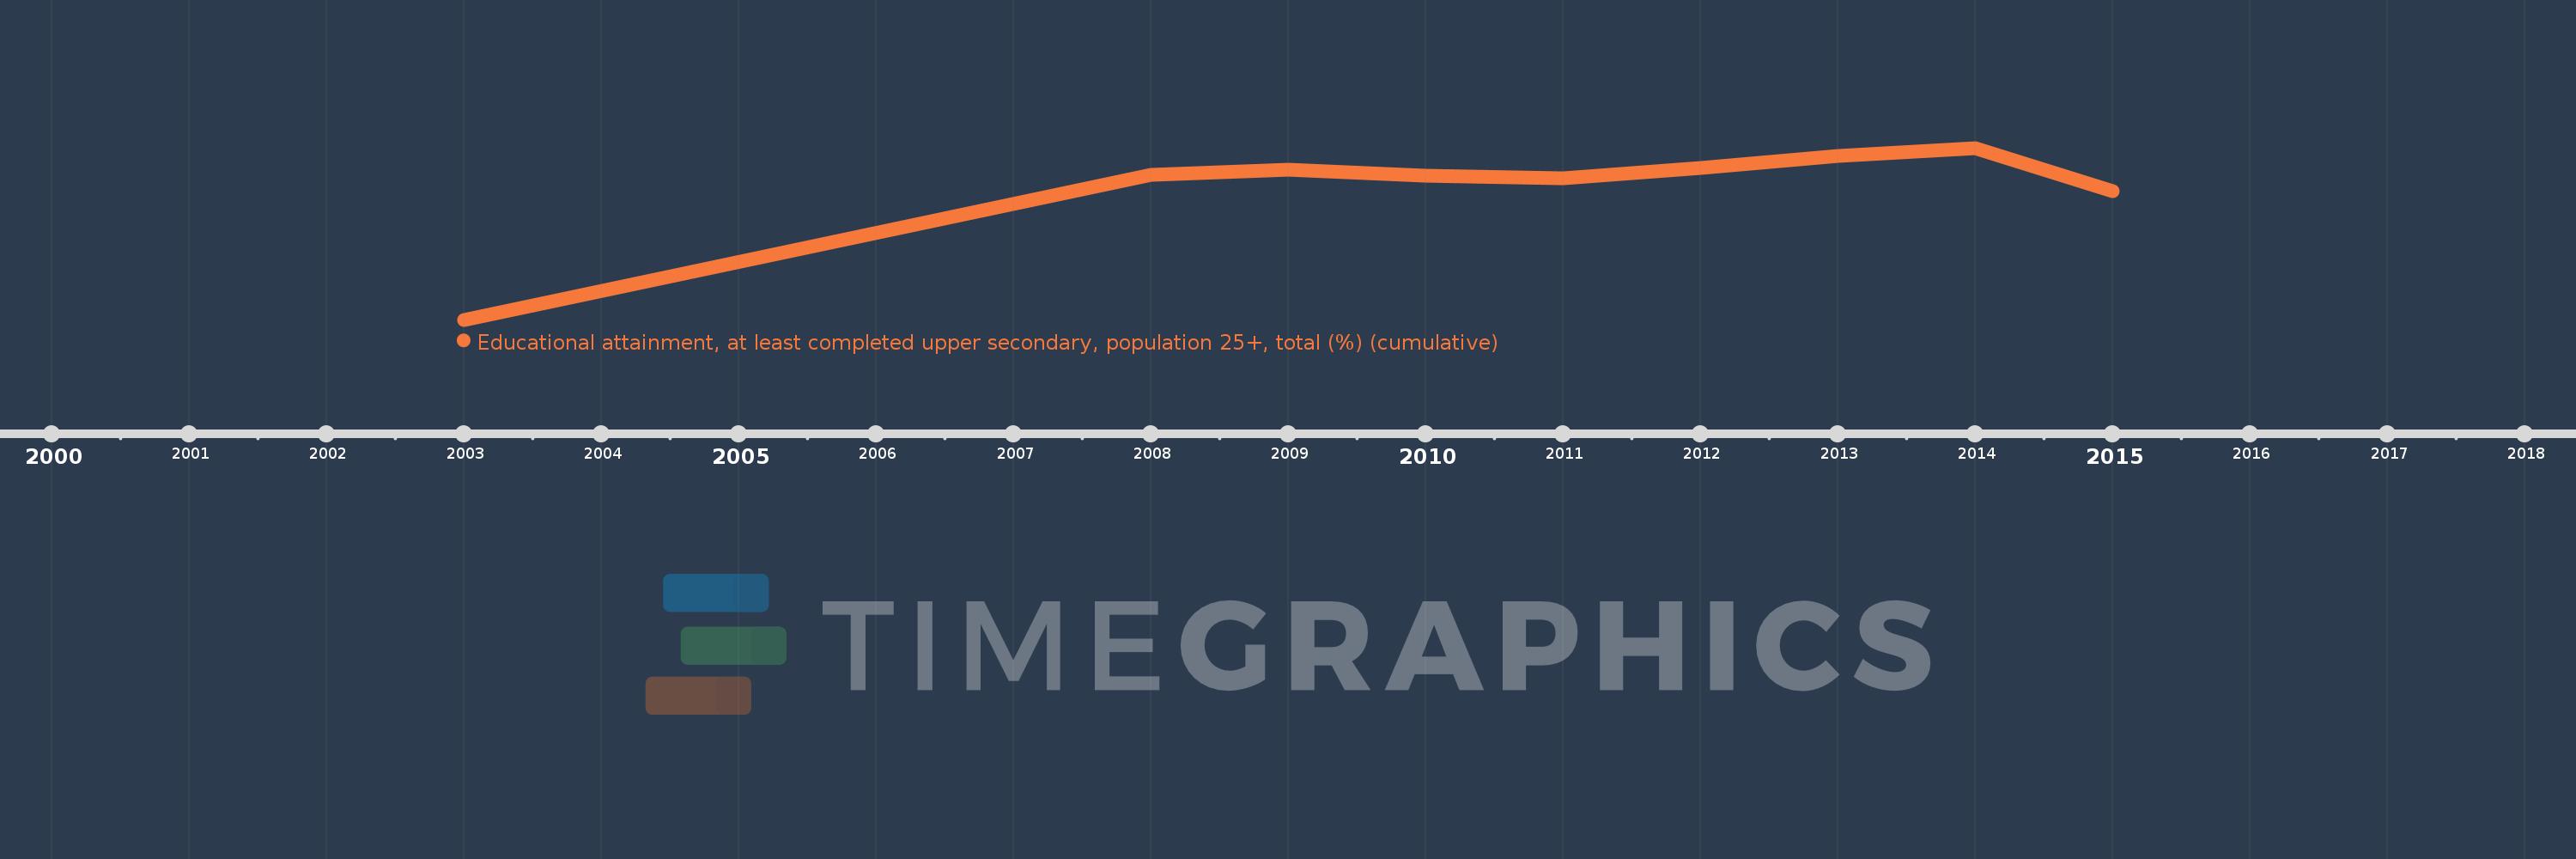
Diese Zeitleiste vorliegt die Graphik ab 2003 J. bis 2015 J. Romania. Die Angaben bis 2002 J. sind nicht vorhanden. Die Zahl aktueller Beobachtungen nach Daten: 9.
Die Quelle (Bezeichnung):
Kennzahlen der Weltentwicklung
Die Quelle (Einrichtung):
United Nations Educational, Scientific, and Cultural Organization (UNESCO) Institute for Statistics.
Kategorien:
Education, Gender
Es wurde aktualisiert:
23 Apr 2017 Jahr
Kennzahlen der Wertänderungen vom Jahr zum Jahr
im Durchschnitt:
63.338
Minimum:
52.653
1 Jan 2003 Jahr
Maximum:
66.459
1 Jan 2014 Jahr
Zum Datum der Beobachtung
Wert
Absolute Veränderung
Die Veränderung bezüglich dem vorherigen Wert
1 Jan 2003 Jahr
52.653
+52.653
0.0%
1 Jan 2008 Jahr
64.272
+11.619
22.07%
1 Jan 2009 Jahr
64.718
+0.446
0.69%
1 Jan 2010 Jahr
64.227
-0.49
-0.76%
1 Jan 2011 Jahr
64.032
-0.196
-0.3%
1 Jan 2012 Jahr
64.862
+0.83
1.3%
1 Jan 2013 Jahr
65.838
+0.977
1.51%
1 Jan 2014 Jahr
66.459
+0.621
0.94%
1 Jan 2015 Jahr
62.981
-3.478
-5.23%
Bewertung der Länder gemäß mit laufender Statistik nach Jahren