30
/de/
AIzaSyAYiBZKx7MnpbEhh9jyipgxe19OcubqV5w
April 1, 2024
222222
Peru
PER
true
2
1
Government expenditure per student, secondary (% of GDP per capita)
2015,2014,2013,2012,2011,2010,2009,2008,2007,2006,2005,2004,2003,2002,2001,2000,1999
Download
Bibliothek der Globalstatistik →Peru →

Government expenditure per student, secondary (% of GDP per capita)

Diese Statistik in anderen Ländern:

AlbaniaAlgeriaAndorraAntigua and BarbudaArgentinaArmeniaArubaAustraliaAustriaBangladeshBarbadosBelgiumBelizeBeninBermudaBhutanBoliviaBotswanaBrazilBritish Virgin IslandsBrunei DarussalamBulgariaBurkina FasoBurundiCabo VerdeCambodiaCameroonCanadaCaribbean small statesCentral African RepublicCentral Europe and the BalticsChadChileChinaColombiaComorosCongo, Dem. Rep.Congo, Rep.Costa RicaCote d'IvoireCubaCuracaoCyprusCzech RepublicDenmarkDjiboutiDominicaDominican RepublicEast Asia & PacificEcuadorEl SalvadorEritreaEstoniaEthiopiaEuro areaEurope & Central AsiaEuropean UnionFijiFinlandFranceGambia, TheGeorgiaGermanyGhanaGreeceGrenadaGuatemalaGuineaGuyanaHigh incomeHondurasHong Kong SAR, ChinaHungaryIBRD onlyIcelandIndiaIndonesiaIran, Islamic Rep.IrelandIsraelItalyJamaicaJapanJordanKazakhstanKenyaKorea, Rep.KuwaitKyrgyz RepublicLao PDRLate-demographic dividendLatin America & Caribbean Latin America & Caribbean (excluding high income)Latin America & the Caribbean (IDA & IBRD countries)LatviaLebanonLesothoLiechtensteinLithuaniaLuxembourgMacao SAR, ChinaMadagascarMalawiMalaysiaMaliMaltaMarshall IslandsMauritaniaMauritiusMexicoMiddle East & North Africa (excluding high income)Middle East & North Africa (IDA & IBRD countries)MoldovaMonacoMongoliaMoroccoMozambiqueNamibiaNepalNetherlandsNew ZealandNicaraguaNigerNorth AmericaNorwayOECD membersOmanOther small statesPakistanPanamaParaguayPeruPhilippinesPolandPortugalPost-demographic dividendPuerto RicoQatarRomaniaRwandaSamoaSan MarinoSao Tome and PrincipeSaudi ArabiaSenegalSerbiaSeychellesSierra LeoneSingaporeSlovak RepublicSloveniaSmall statesSouth AfricaSouth AsiaSouth Asia (IDA & IBRD)SpainSri LankaSt. LuciaSt. Vincent and the GrenadinesSwazilandSwedenSwitzerlandSyrian Arab RepublicTanzaniaThailandTimor-LesteTogoTongaTunisiaUgandaUkraineUnited Arab EmiratesUnited KingdomUnited StatesUruguayVanuatuVenezuela, RBWorldYemen, Rep.

Zeitlinie:

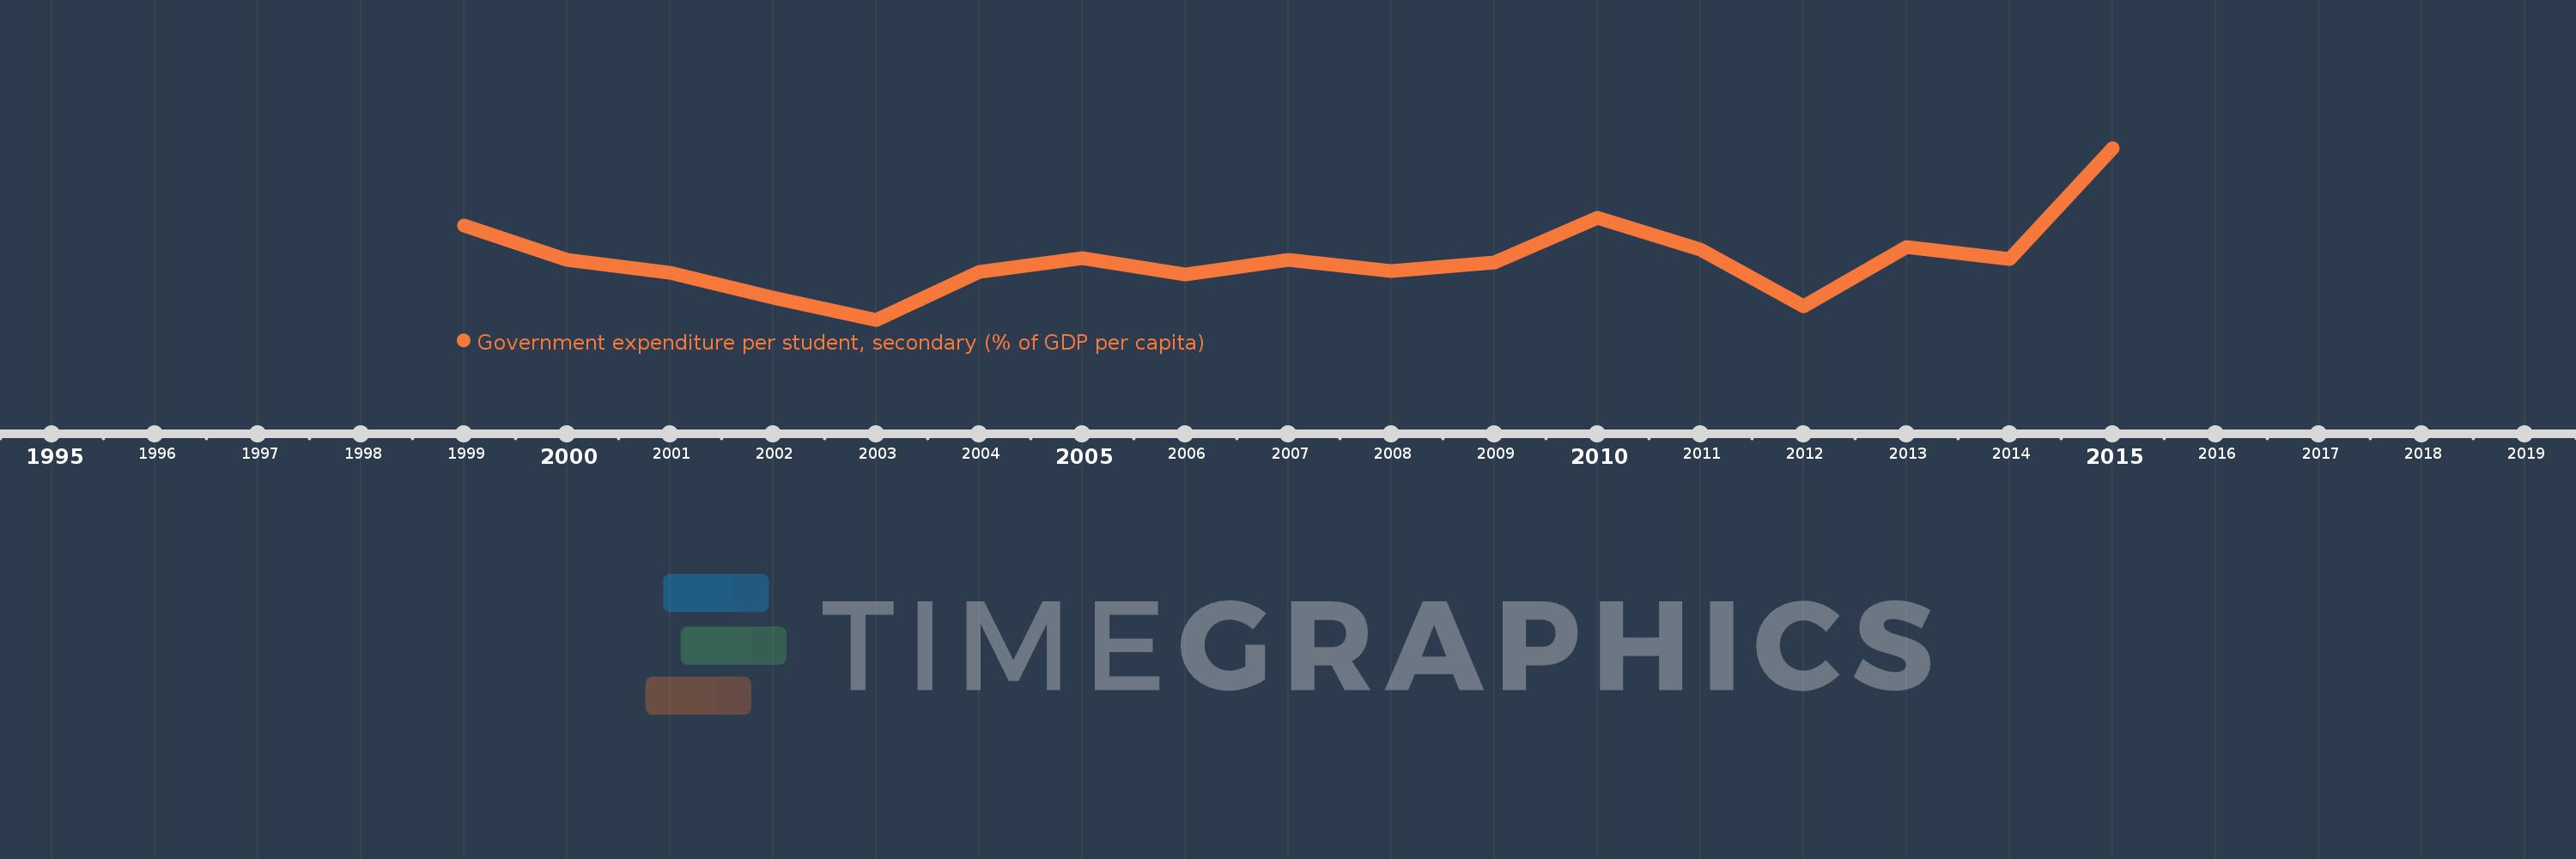
Diese Zeitleiste vorliegt die Graphik ab 1999 J. bis 2015 J. Peru. Die Angaben bis 1998 J. sind nicht vorhanden. Die Zahl aktueller Beobachtungen nach Daten: 17.

Die Quelle (Bezeichnung):

Kennzahlen der Weltentwicklung

Die Quelle (Einrichtung):

United Nations Educational, Scientific, and Cultural Organization (UNESCO) Institute for Statistics.

Kategorien:

Education

Es wurde aktualisiert:

23 Apr 2017 Jahr

Kennzahlen der Wertänderungen vom Jahr zum Jahr

im Durchschnitt:
10.476
Minimum:
9.065
1 Jan 2003 Jahr
Maximum:
13.047
1 Jan 2015 Jahr
Zum Datum der Beobachtung
Wert
Absolute Veränderung
Die Veränderung bezüglich dem vorherigen Wert
1 Jan 1999 Jahr
11.243
+11.243
0.0%
1 Jan 2000 Jahr
10.455
-0.788
-7.01%
1 Jan 2001 Jahr
10.149
-0.305
-2.92%
1 Jan 2002 Jahr
9.579
-0.571
-5.62%
1 Jan 2003 Jahr
9.065
-0.514
-5.36%
1 Jan 2004 Jahr
10.168
+1.103
12.16%
1 Jan 2005 Jahr
10.485
+0.318
3.12%
1 Jan 2006 Jahr
10.11
-0.375
-3.58%
1 Jan 2007 Jahr
10.457
+0.347
3.43%
1 Jan 2008 Jahr
10.203
-0.253
-2.42%
1 Jan 2009 Jahr
10.396
+0.193
1.89%
1 Jan 2010 Jahr
11.426
+1.031
9.91%
1 Jan 2011 Jahr
10.7
-0.727
-6.36%
1 Jan 2012 Jahr
9.382
-1.317
-12.31%
1 Jan 2013 Jahr
10.754
+1.371
14.62%
1 Jan 2014 Jahr
10.471
-0.283
-2.63%
1 Jan 2015 Jahr
13.047
+2.576
24.6%

Bewertung der Länder gemäß mit laufender Statistik nach Jahren