Download Diese Statistik in anderen Ländern:
AfghanistanAlbaniaAlgeriaAngolaAntigua and BarbudaArmeniaAzerbaijanBahamas, TheBahrainBangladeshBarbadosBelarusBelizeBeninBhutanBoliviaBosnia and HerzegovinaBotswanaBrazilBurkina FasoBurundiCabo VerdeCambodiaCentral African RepublicChileColombiaCongo, Dem. Rep.Congo, Rep.Costa RicaCote d'IvoireCroatiaCyprusDominicaDominican RepublicEgypt, Arab Rep.El SalvadorEquatorial GuineaEthiopiaFijiGambia, TheGeorgiaGhanaGrenadaGuatemalaHondurasIndiaIndonesiaIran, Islamic Rep.IraqIsraelJamaicaJordanKazakhstanKenyaKiribatiKorea, Rep.KuwaitKyrgyz RepublicLao PDRLebanonLesothoLiberiaMacao SAR, ChinaMacedonia, FYRMadagascarMalawiMalaysiaMaldivesMaliMaltaMauritiusMexicoMicronesia, Fed. Sts.MoldovaMongoliaMoroccoMozambiqueMyanmarNamibiaNepalNicaraguaNigeriaOmanPakistanPanamaPapua New GuineaParaguayPeruPhilippinesRwandaSamoaSao Tome and PrincipeSenegalSerbiaSeychellesSierra LeoneSingaporeSloveniaSolomon IslandsSouth AfricaSri LankaSt. Kitts and NevisSt. LuciaSurinameSwazilandSyrian Arab RepublicTajikistanTanzaniaThailandTimor-LesteTogoTrinidad and TobagoTunisiaTurkeyUgandaUkraineUruguayVanuatuVenezuela, RBVietnamWest Bank and GazaYemen, Rep.ZambiaZimbabwe Zeitlinie:
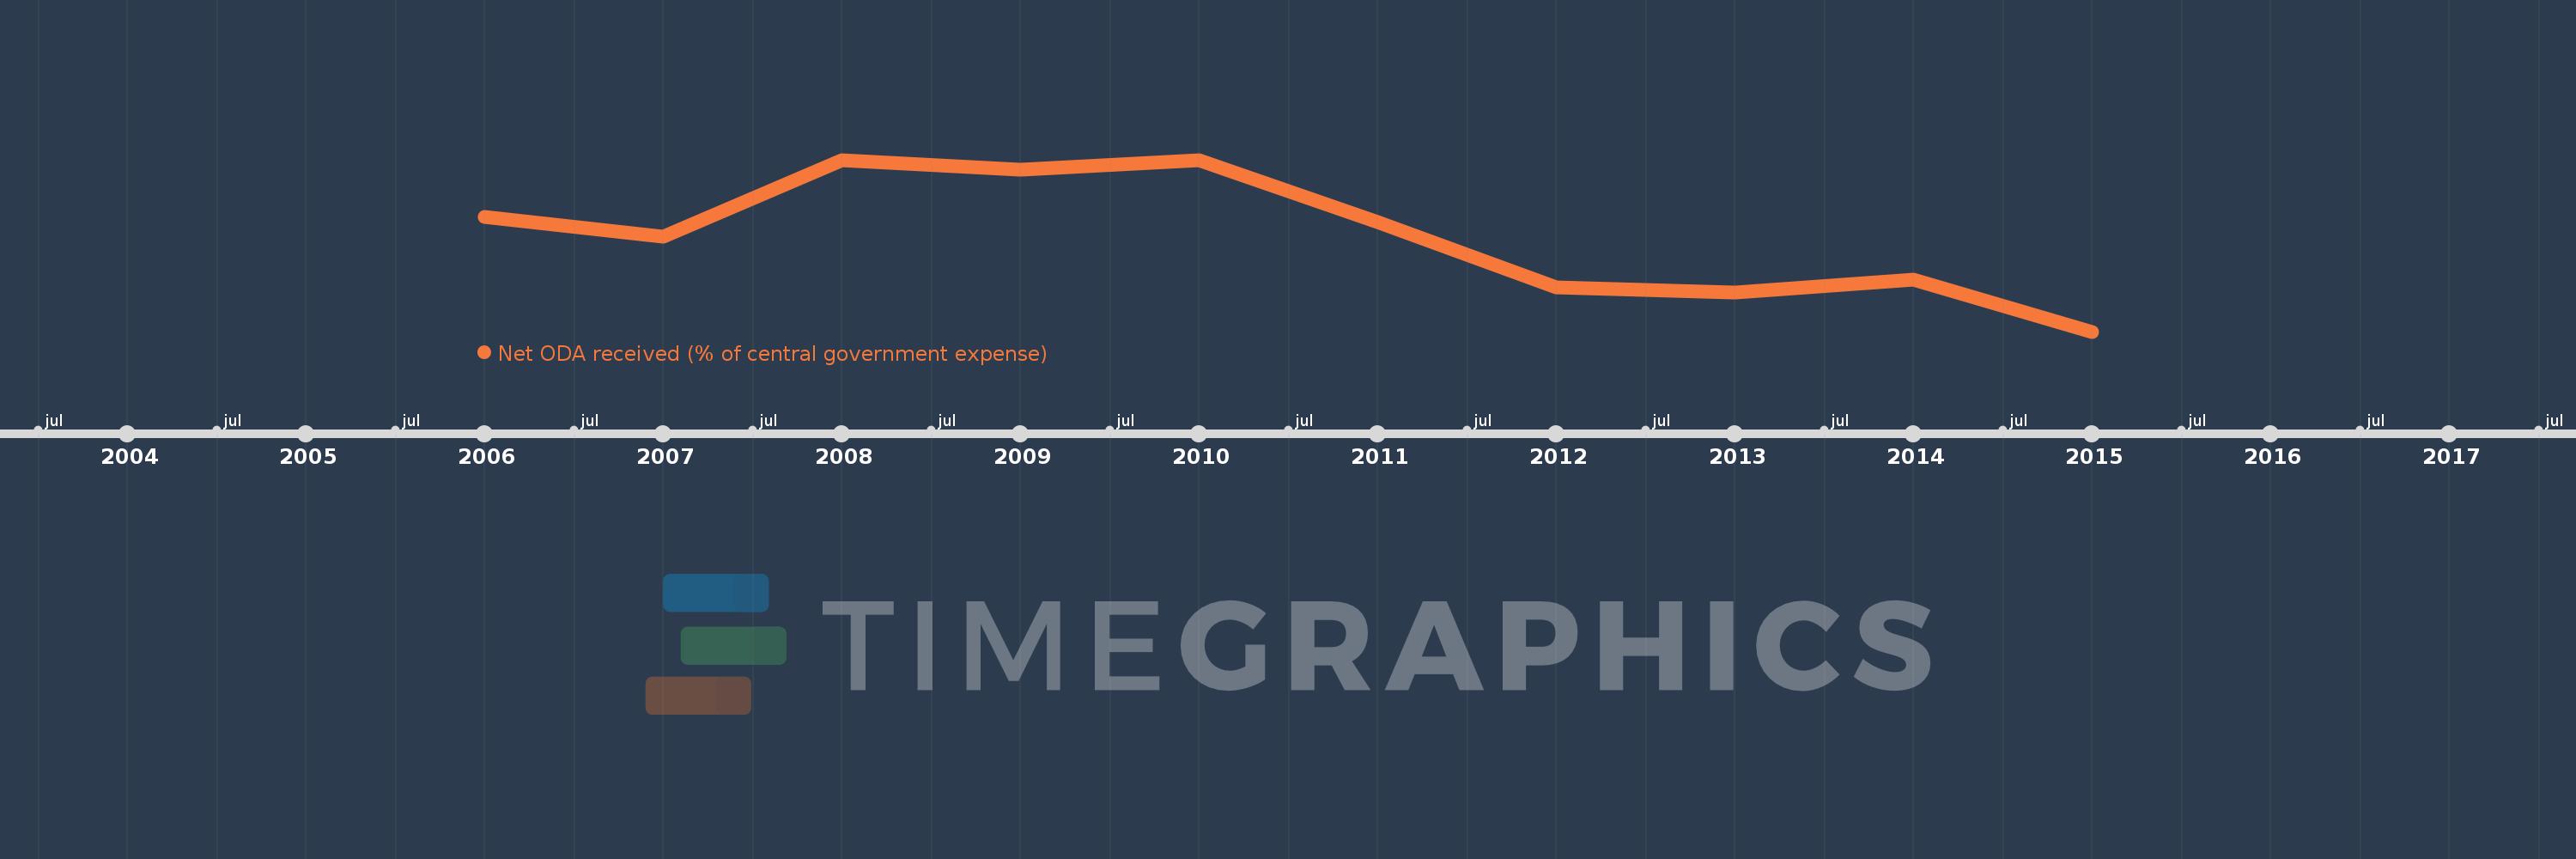
Diese Zeitleiste vorliegt die Graphik ab 2006 J. bis 2015 J. Paraguay. Die Angaben bis 2005 J. sind nicht vorhanden. Die Zahl aktueller Beobachtungen nach Daten: 10.
Die Quelle (Bezeichnung):
Kennzahlen der Weltentwicklung
Die Quelle (Einrichtung):
Development Assistance Committee of the Organisation for Economic Co-operation and Development, Geographical Distribution of Financial Flows to Developing Countries, Development Co-operation Report, and International Development Statistics database. Data are available online at: www.oecd.org/dac/stats/idsonline. IMF central government expense estimates are used for the denominator.
Kategorien:
Aid Effectiveness
Es wurde aktualisiert:
23 Apr 2017 Jahr
Kennzahlen der Wertänderungen vom Jahr zum Jahr
Minimum:
1.013
1 Jan 2015 Jahr
Maximum:
5.265
1 Jan 2008 Jahr
Zum Datum der Beobachtung
Wert
Absolute Veränderung
Die Veränderung bezüglich dem vorherigen Wert
1 Jan 2006 Jahr
3.842
+3.842
0.0%
1 Jan 2007 Jahr
3.371
-0.471
-12.26%
1 Jan 2008 Jahr
5.265
+1.894
56.2%
1 Jan 2009 Jahr
5.017
-0.248
-4.71%
1 Jan 2010 Jahr
5.256
+0.239
4.77%
1 Jan 2011 Jahr
3.725
-1.531
-29.14%
1 Jan 2012 Jahr
2.102
-1.623
-43.57%
1 Jan 2013 Jahr
1.97
-0.132
-6.29%
1 Jan 2014 Jahr
2.302
+0.332
16.88%
1 Jan 2015 Jahr
1.013
-1.289
-55.98%
Bewertung der Länder gemäß mit laufender Statistik nach Jahren