33
/de/
AIzaSyB4mHJ5NPEv-XzF7P6NDYXjlkCWaeKw5bc
November 30, 2025
220207
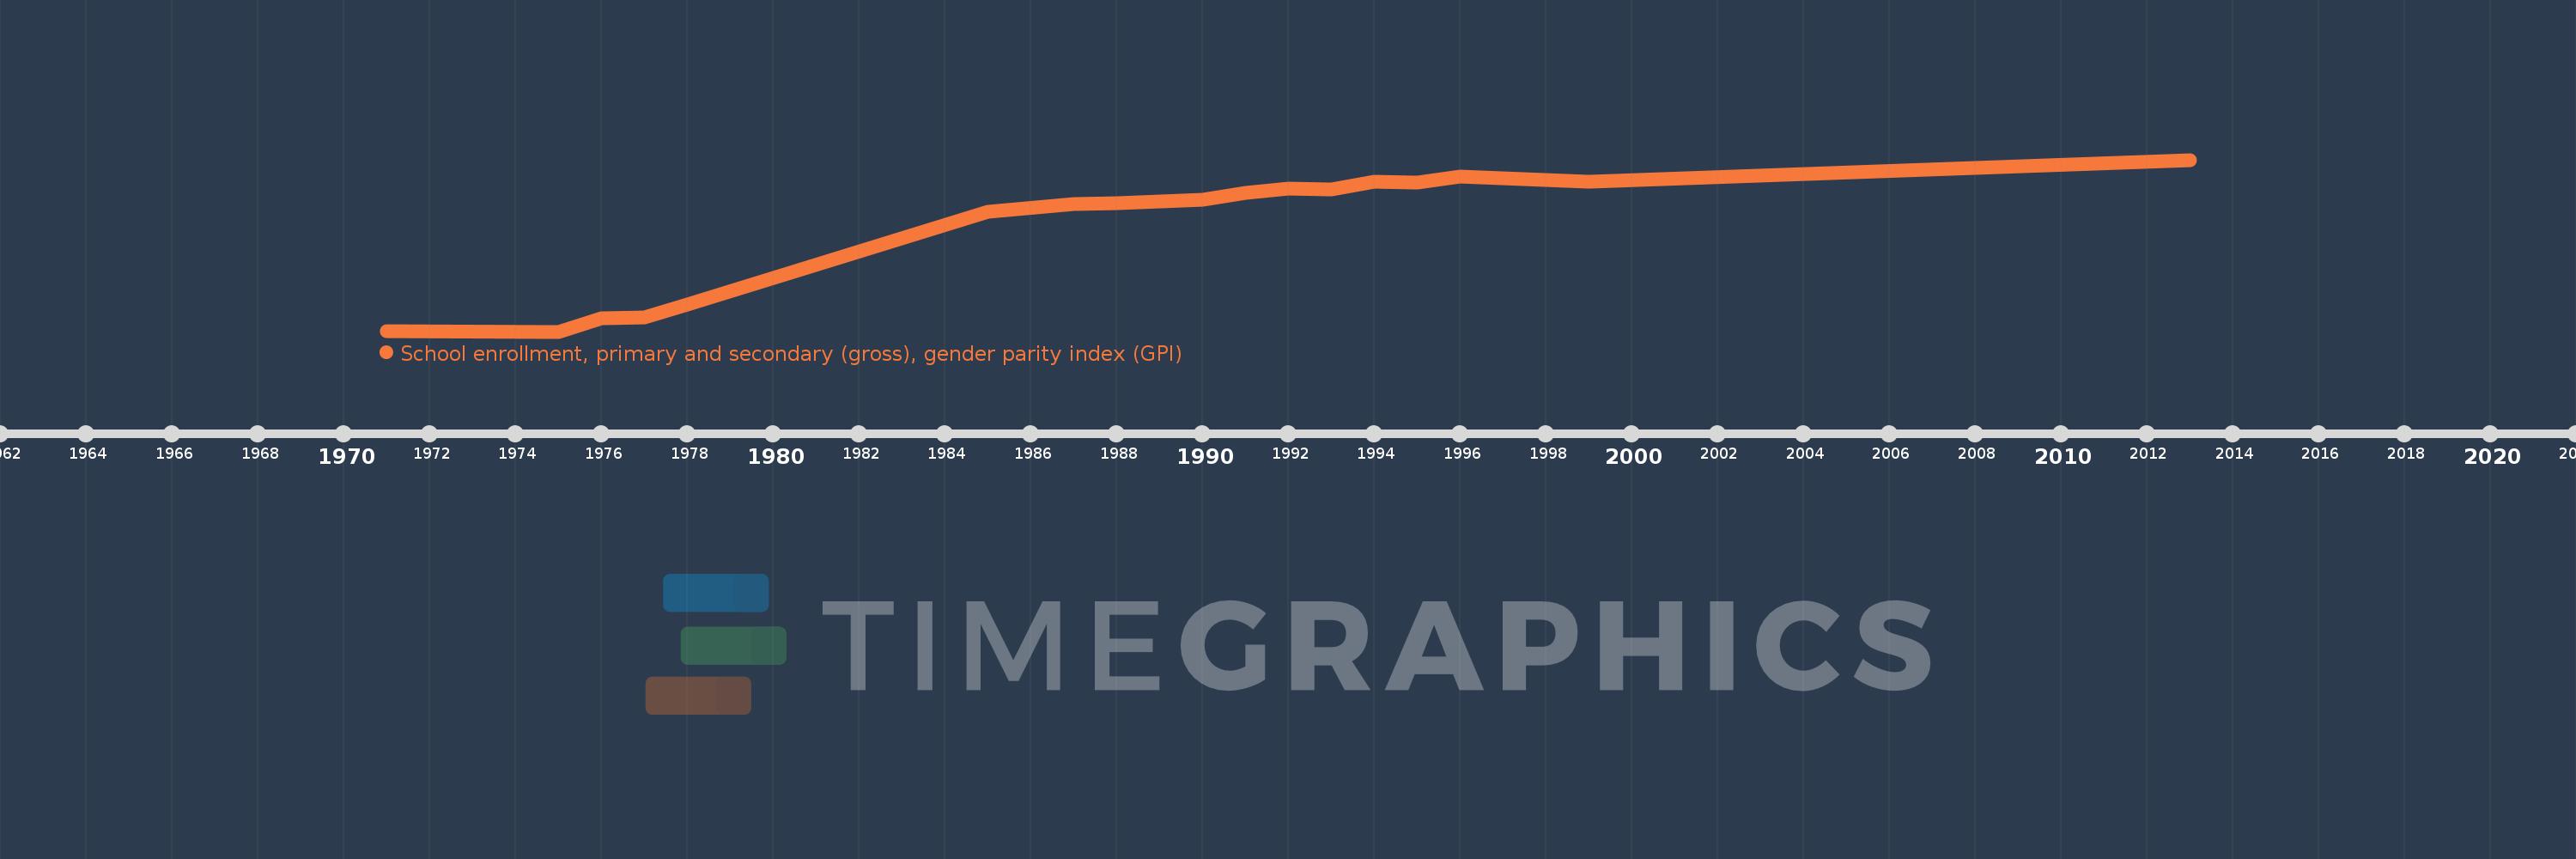
Papua New Guinea
PNG
true
2
1
School enrollment, primary and secondary (gross), gender parity index (GPI)
2013,1999,1996,1995,1994,1993,1992,1991,1990,1989,1988,1987,1985,1978,1977,1976,1975,1971