30
/de/
AIzaSyAYiBZKx7MnpbEhh9jyipgxe19OcubqV5w
April 1, 2024
203297
Mozambique
MOZ
true
2
1
Net intake rate to Grade 1 of primary education, both sexes (%)
2015,2014,2013,2012,2011,2010,2009,2008,2007,2006,2005,2003,2002,2001,2000,1999
Download
Bibliothek der Globalstatistik →Mozambique →

Net intake rate to Grade 1 of primary education, both sexes (%)

Diese Statistik in anderen Ländern:

AfghanistanAlbaniaAlgeriaAngolaAntigua and BarbudaArab WorldArmeniaArubaAzerbaijanBahamas, TheBahrainBangladeshBarbadosBelarusBelizeBeninBermudaBhutanBoliviaBosnia and HerzegovinaBotswanaBrunei DarussalamBulgariaBurkina FasoBurundiCabo VerdeCambodiaCameroonCaribbean small statesCentral African RepublicChadChileColombiaComorosCongo, Dem. Rep.Congo, Rep.Costa RicaCote d'IvoireCroatiaCubaCyprusDenmarkDjiboutiDominicaDominican RepublicEarly-demographic dividendEast Asia & PacificEast Asia & Pacific (excluding high income)East Asia & Pacific (IDA & IBRD countries)EcuadorEgypt, Arab Rep.El SalvadorEquatorial GuineaEritreaEstoniaEthiopiaEuro areaEurope & Central AsiaEurope & Central Asia (excluding high income)Europe & Central Asia (IDA & IBRD countries)FijiFragile and conflict affected situationsGambia, TheGeorgiaGhanaGreeceGrenadaGuatemalaGuineaGuinea-BissauGuyanaHeavily indebted poor countries (HIPC)High incomeHondurasIBRD onlyIcelandIDA & IBRD totalIDA onlyIDA totalIndonesiaIran, Islamic Rep.IraqIrelandItalyJapanJordanKazakhstanKenyaKorea, Dem. People’s Rep.Korea, Rep.KuwaitKyrgyz RepublicLao PDRLate-demographic dividendLatin America & Caribbean Latin America & Caribbean (excluding high income)Latin America & the Caribbean (IDA & IBRD countries)Least developed countries: UN classificationLebanonLesothoLiberiaLiechtensteinLithuaniaLow & middle incomeLow incomeLuxembourgMacedonia, FYRMadagascarMalawiMaldivesMaliMaltaMarshall IslandsMauritaniaMauritiusMexicoMicronesia, Fed. Sts.Middle East & North AfricaMiddle East & North Africa (excluding high income)Middle East & North Africa (IDA & IBRD countries)Middle incomeMoldovaMongoliaMontenegroMoroccoMozambiqueNamibiaNauruNepalNicaraguaNigerNorth AmericaNorwayOECD membersOmanOther small statesPacific island small statesParaguayPeruPhilippinesPortugalPost-demographic dividendPre-demographic dividendPuerto RicoQatarRomaniaRwandaSamoaSan MarinoSao Tome and PrincipeSaudi ArabiaSenegalSerbiaSeychellesSierra LeoneSloveniaSmall statesSolomon IslandsSouth AfricaSpainSri LankaSt. Kitts and NevisSt. LuciaSt. Vincent and the GrenadinesSub-Saharan Africa Sub-Saharan Africa (excluding high income)Sub-Saharan Africa (IDA & IBRD countries)SurinameSwazilandSwedenSwitzerlandSyrian Arab RepublicTajikistanTanzaniaThailandTimor-LesteTogoTongaTrinidad and TobagoTunisiaTurkeyUgandaUkraineUnited Arab EmiratesUnited StatesUpper middle incomeUruguayUzbekistanVanuatuVenezuela, RBWest Bank and GazaWorldYemen, Rep.ZambiaZimbabwe

Zeitlinie:

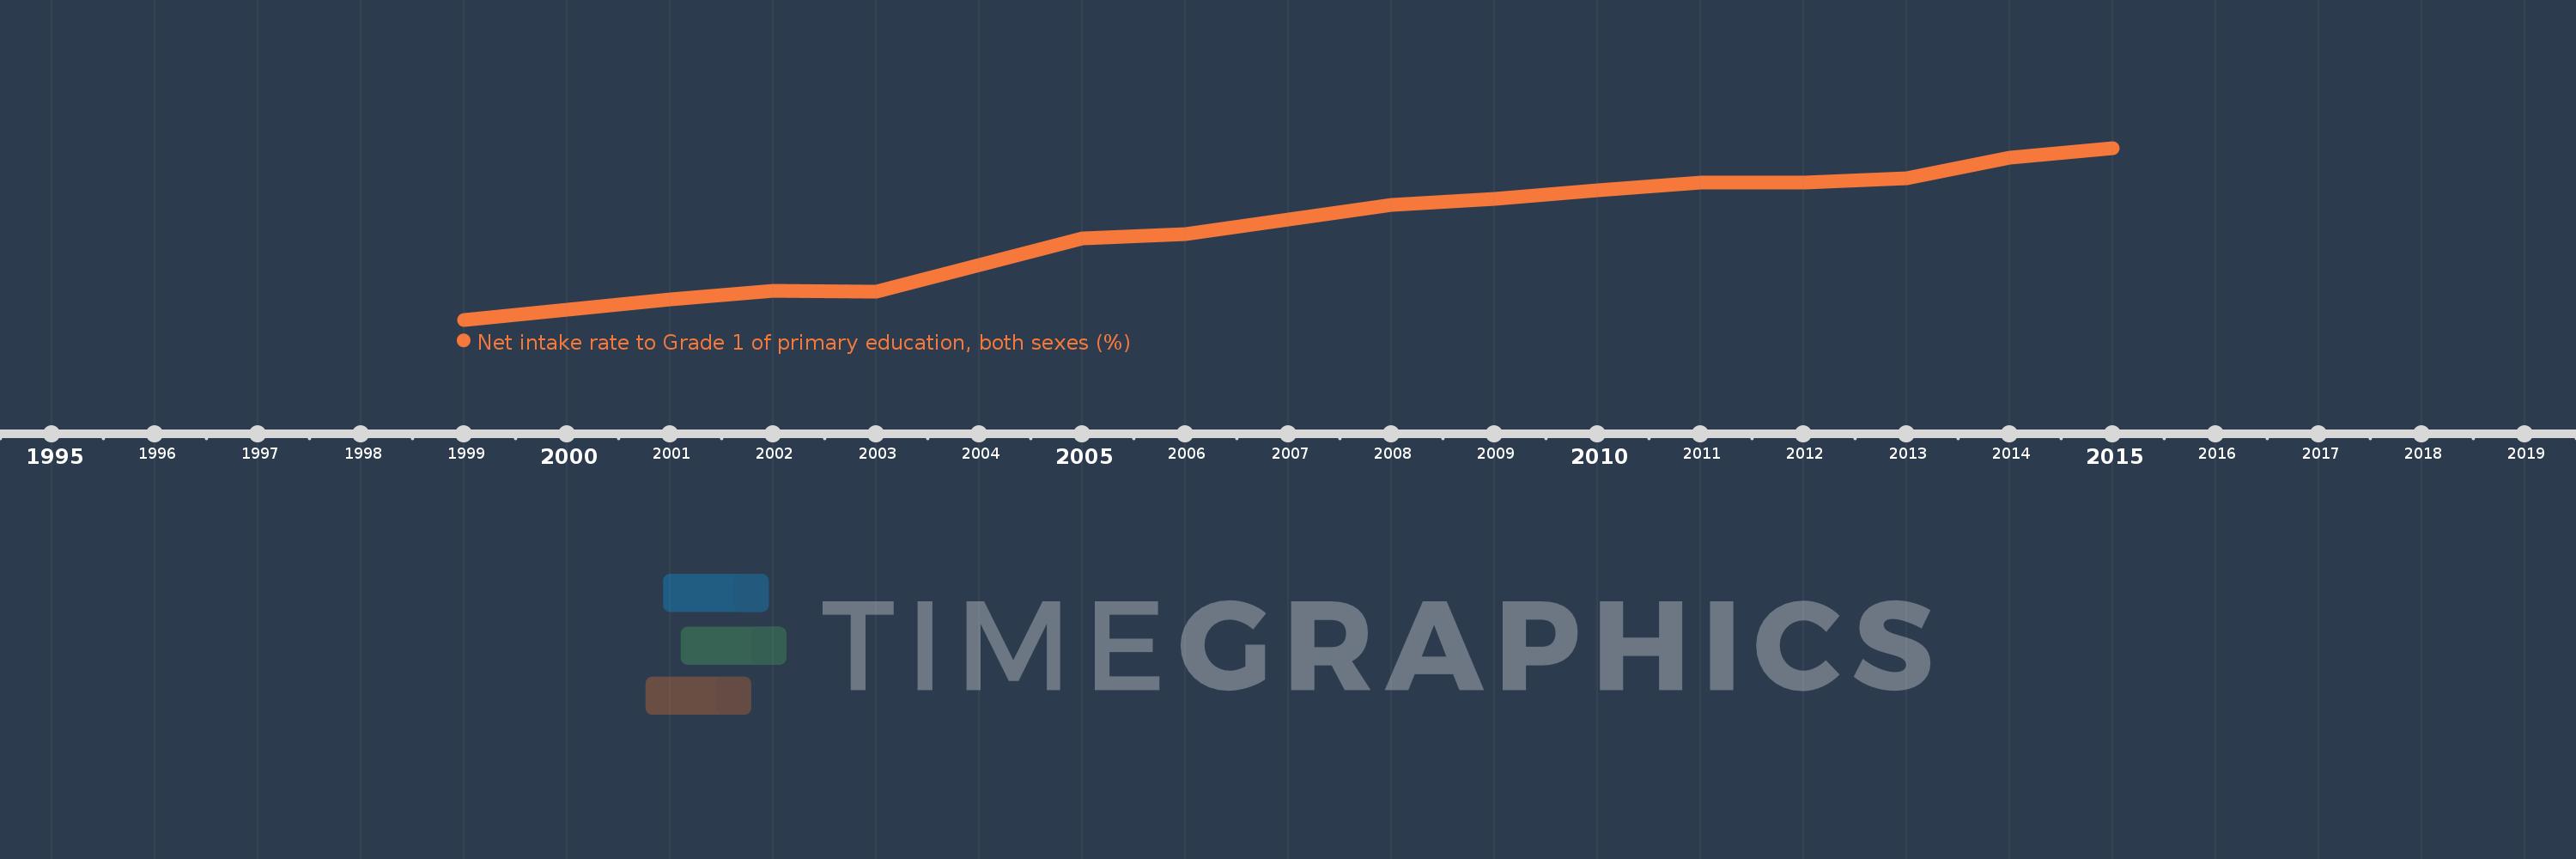
Diese Zeitleiste vorliegt die Graphik ab 1999 J. bis 2015 J. Mozambique. Die Angaben bis 1998 J. sind nicht vorhanden. Die Zahl aktueller Beobachtungen nach Daten: 16.

Die Quelle (Bezeichnung):

Kennzahlen der Weltentwicklung

Die Quelle (Einrichtung):

UNESCO Institute for Statistics

Kategorien:

Education

Es wurde aktualisiert:

23 Apr 2017 Jahr

Kennzahlen der Wertänderungen vom Jahr zum Jahr

im Durchschnitt:
45.822
Minimum:
13.708
1 Jan 1999 Jahr
Maximum:
73.808
1 Jan 2015 Jahr
Zum Datum der Beobachtung
Wert
Absolute Veränderung
Die Veränderung bezüglich dem vorherigen Wert
1 Jan 1999 Jahr
13.708
+13.708
0.0%
1 Jan 2000 Jahr
17.31
+3.602
26.28%
1 Jan 2001 Jahr
20.846
+3.536
20.43%
1 Jan 2002 Jahr
23.713
+2.867
13.75%
1 Jan 2003 Jahr
23.443
-0.27
-1.14%
1 Jan 2005 Jahr
42.12
+18.677
79.67%
1 Jan 2006 Jahr
43.661
+1.541
3.66%
1 Jan 2007 Jahr
48.909
+5.248
12.02%
1 Jan 2008 Jahr
53.744
+4.835
9.89%
1 Jan 2009 Jahr
56.079
+2.335
4.34%
1 Jan 2010 Jahr
58.928
+2.849
5.08%
1 Jan 2011 Jahr
61.633
+2.705
4.59%
1 Jan 2012 Jahr
61.689
+0.057
0.09%
1 Jan 2013 Jahr
63.213
+1.524
2.47%
1 Jan 2014 Jahr
70.34
+7.126
11.27%
1 Jan 2015 Jahr
73.808
+3.468
4.93%

Bewertung der Länder gemäß mit laufender Statistik nach Jahren