29
/de/
de
AIzaSyAYiBZKx7MnpbEhh9jyipgxe19OcubqV5w
April 1, 2024
190563
Mali
MLI
true
2
1
Net bilateral aid flows from DAC donors, Finland (current US$)
2015,2014,2013,2012,2011,2010,2009,2008,2007,2006,2005,2004,2003,2002,2001,1993,1992,1987,1985,1984,1976
Download
Bibliothek der Globalstatistik →Mali →

Net bilateral aid flows from DAC donors, Finland (current US$)

Diese Statistik in anderen Ländern:
AfghanistanAlbaniaAlgeriaAngolaAntigua and BarbudaArab WorldArgentinaArmeniaAzerbaijanBahamas, TheBahrainBangladeshBarbadosBelarusBelizeBeninBhutanBoliviaBosnia and HerzegovinaBotswanaBrazilBrunei DarussalamBulgariaBurkina FasoBurundiCabo VerdeCambodiaCameroonCaribbean small statesCayman IslandsCentral African RepublicCentral Europe and the BalticsChadChileChinaColombiaComorosCongo, Dem. Rep.Congo, Rep.Costa RicaCote d'IvoireCroatiaCubaCyprusCzech RepublicDjiboutiDominicaDominican RepublicEast Asia & PacificEast Asia & Pacific (excluding high income)East Asia & Pacific (IDA & IBRD countries)EcuadorEgypt, Arab Rep.El SalvadorEquatorial GuineaEritreaEstoniaEthiopiaEuro areaEurope & Central AsiaEurope & Central Asia (excluding high income)Europe & Central Asia (IDA & IBRD countries)European UnionFijiFragile and conflict affected situationsFrench PolynesiaGabonGambia, TheGeorgiaGhanaGrenadaGuatemalaGuineaGuinea-BissauGuyanaHaitiHeavily indebted poor countries (HIPC)High incomeHondurasHong Kong SAR, ChinaHungaryIBRD onlyIDA & IBRD totalIDA blendIDA onlyIDA totalIndiaIndonesiaIran, Islamic Rep.IraqIsraelJamaicaJordanKazakhstanKenyaKiribatiKorea, Dem. People’s Rep.Korea, Rep.KosovoKuwaitKyrgyz RepublicLao PDRLatin America & Caribbean Latin America & Caribbean (excluding high income)Latin America & the Caribbean (IDA & IBRD countries)LatviaLeast developed countries: UN classificationLebanonLesothoLiberiaLibyaLithuaniaLow & middle incomeLow incomeLower middle incomeMacedonia, FYRMadagascarMalawiMalaysiaMaldivesMaliMauritaniaMauritiusMexicoMiddle East & North AfricaMiddle East & North Africa (excluding high income)Middle East & North Africa (IDA & IBRD countries)Middle incomeMoldovaMongoliaMontenegroMoroccoMozambiqueMyanmarNamibiaNepalNew CaledoniaNicaraguaNigerNigeriaNorthern Mariana IslandsOECD membersOmanOther small statesPacific island small statesPakistanPalauPanamaPapua New GuineaParaguayPeruPhilippinesPolandRomaniaRussian FederationRwandaSamoaSao Tome and PrincipeSaudi ArabiaSenegalSerbiaSeychellesSierra LeoneSingaporeSlovak RepublicSmall statesSolomon IslandsSomaliaSouth AfricaSouth AsiaSouth Asia (IDA & IBRD)South SudanSri LankaSt. Kitts and NevisSt. LuciaSt. Vincent and the GrenadinesSub-Saharan Africa Sub-Saharan Africa (excluding high income)Sub-Saharan Africa (IDA & IBRD countries)SudanSurinameSwazilandSyrian Arab RepublicTajikistanTanzaniaThailandTimor-LesteTogoTongaTrinidad and TobagoTunisiaTurkeyTurkmenistanTuvaluUgandaUkraineUnited Arab EmiratesUpper middle incomeUruguayUzbekistanVanuatuVenezuela, RBVietnamWest Bank and GazaWorldYemen, Rep.ZambiaZimbabwe
Zeitlinie:
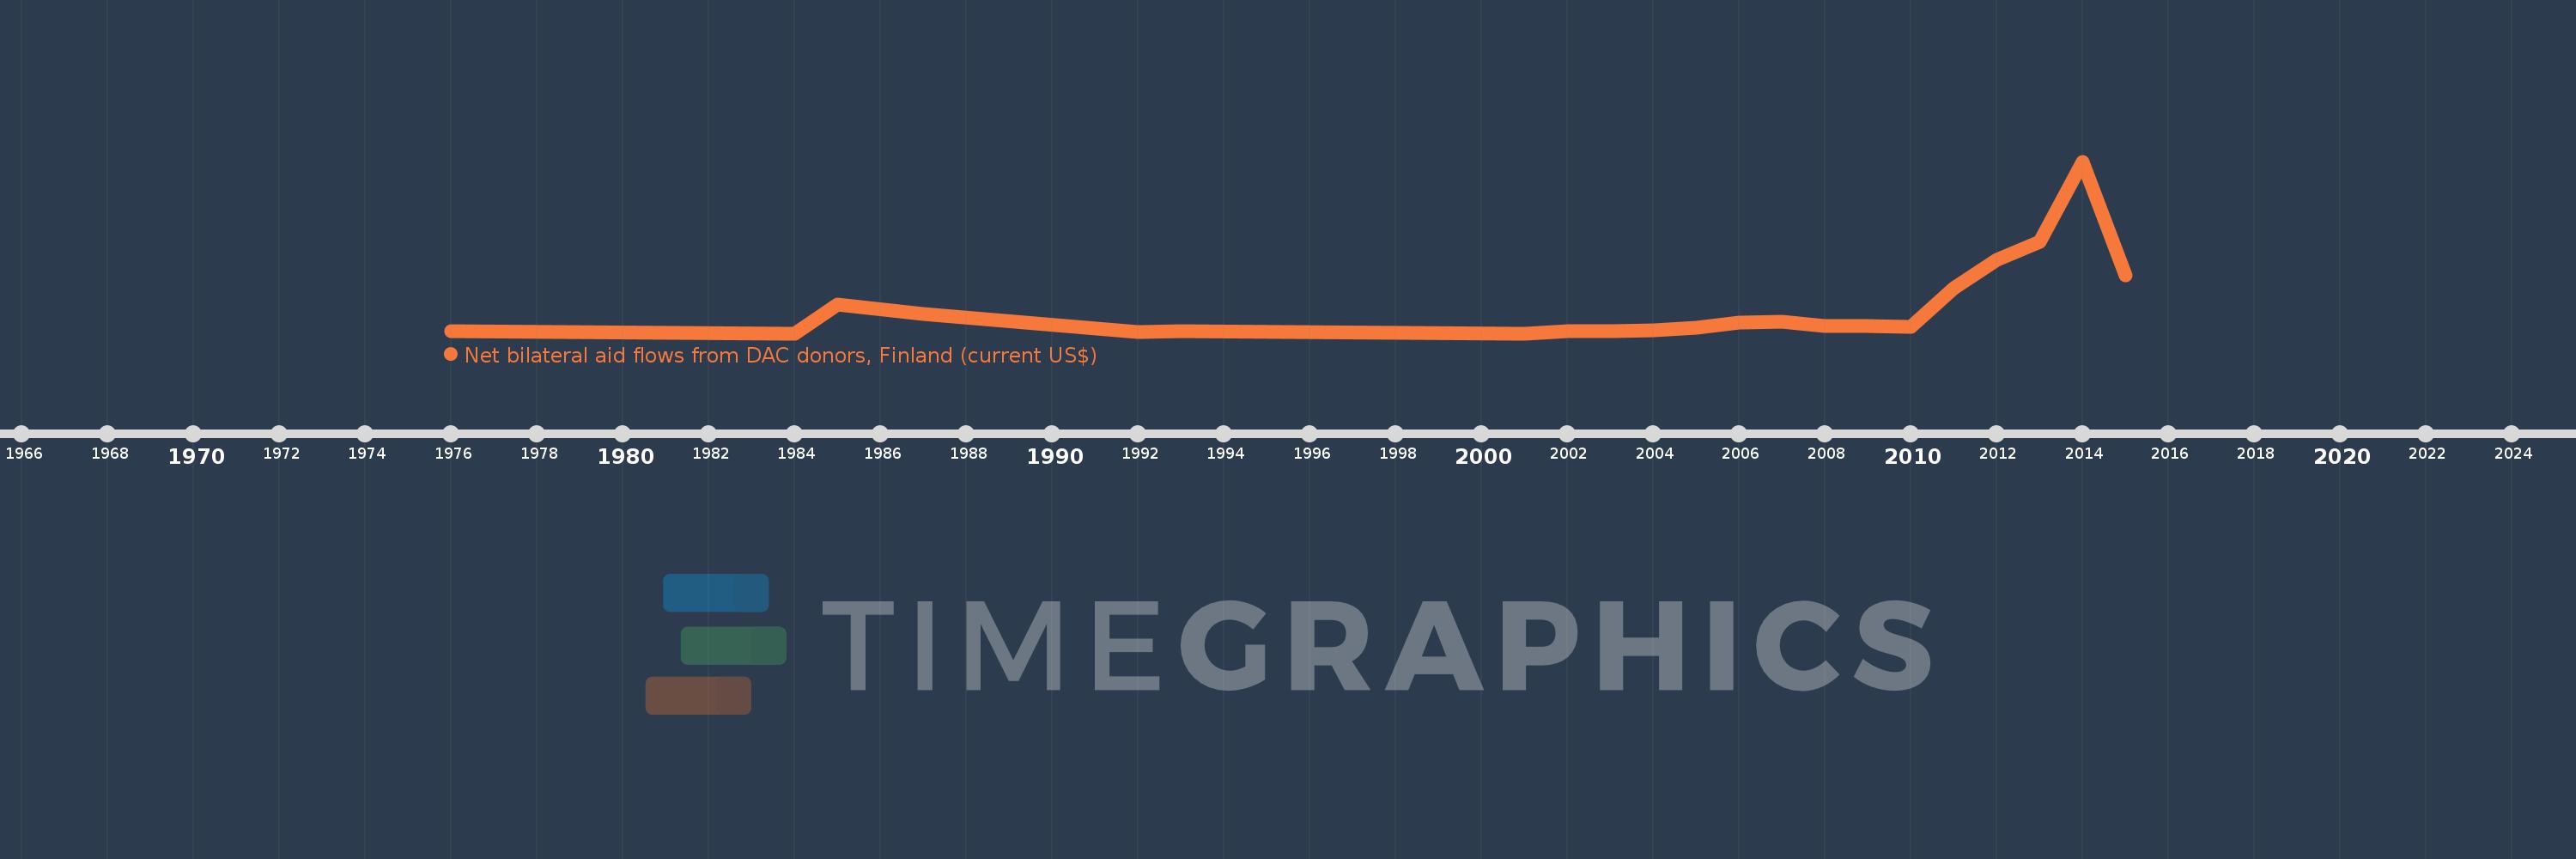
Diese Zeitleiste vorliegt die Graphik ab 1976 J. bis 2015 J. Mali. Die Angaben bis 1975 J. sind nicht vorhanden. Die Zahl aktueller Beobachtungen nach Daten: 21.
Die Quelle (Bezeichnung):
Kennzahlen der Weltentwicklung
Die Quelle (Einrichtung):
Development Assistance Committee of the Organisation for Economic Co-operation and Development, Geographical Distribution of Financial Flows to Developing Countries, Development Co-operation Report, and International Development Statistics database. Data are available online at: www.oecd.org/dac/stats/idsonline.
Kategorien:
Aid Effectiveness
Es wurde aktualisiert:
23 Apr 2017 Jahr
Kennzahlen der Wertänderungen vom Jahr zum Jahr
im Durchschnitt:
423.81 Tsnd.
Minimum:
10.0 Tsnd.
1 Jan 1984 Jahr
Maximum:
2.73 Mln.
1 Jan 2014 Jahr
Zum Datum der Beobachtung
Wert
Absolute Veränderung
Die Veränderung bezüglich dem vorherigen Wert
1 Jan 1976 Jahr
40.0 Tsnd.
+40.0 Tsnd.
0.0%
1 Jan 1984 Jahr
10.0 Tsnd.
-30.0 Tsnd.
-75.0%
1 Jan 1985 Jahr
460.0 Tsnd.
+450.0 Tsnd.
4.5 Tsnd.%
1 Jan 1987 Jahr
310.0 Tsnd.
-150.0 Tsnd.
-32.61%
1 Jan 1992 Jahr
30.0 Tsnd.
-280.0 Tsnd.
-90.32%
1 Jan 1993 Jahr
40.0 Tsnd.
+10.0 Tsnd.
33.33%
1 Jan 2001 Jahr
10.0 Tsnd.
-30.0 Tsnd.
-75.0%
1 Jan 2002 Jahr
40.0 Tsnd.
+30.0 Tsnd.
300.0%
1 Jan 2003 Jahr
50.0 Tsnd.
+10.0 Tsnd.
25.0%
1 Jan 2004 Jahr
60.0 Tsnd.
+10.0 Tsnd.
20.0%
1 Jan 2005 Jahr
100.0 Tsnd.
+40.0 Tsnd.
66.67%
1 Jan 2006 Jahr
180.0 Tsnd.
+80.0 Tsnd.
80.0%
1 Jan 2007 Jahr
190.0 Tsnd.
+10.0 Tsnd.
5.56%
1 Jan 2008 Jahr
130.0 Tsnd.
-60.0 Tsnd.
-31.58%
1 Jan 2009 Jahr
120.0 Tsnd.
-10.0 Tsnd.
-7.69%
1 Jan 2010 Jahr
110.0 Tsnd.
-10.0 Tsnd.
-8.33%
1 Jan 2011 Jahr
730.0 Tsnd.
+620.0 Tsnd.
563.64%
1 Jan 2012 Jahr
1.17 Mln.
+440.0 Tsnd.
60.27%
1 Jan 2013 Jahr
1.46 Mln.
+290.0 Tsnd.
24.79%
1 Jan 2014 Jahr
2.73 Mln.
+1.27 Mln.
86.99%
1 Jan 2015 Jahr
930.0 Tsnd.
-1.8 Mln.
-65.93%
Bewertung der Länder gemäß mit laufender Statistik nach Jahren

Kommentare:

Abschicken
PremiumAbout & FeedbackVereinbarungPrivatheit
logo
© 2022 Selected Technologies LLC – Morgan Hill, California