33
/de/
AIzaSyAYiBZKx7MnpbEhh9jyipgxe19OcubqV5w
August 1, 2025
184222
Macedonia, FYR
MKD
true
2
1
Net bilateral aid flows from DAC donors, Spain (current US$)
2015,2014,2012,2011,2010,2009,2008,2007,2006,2005,2003,2002,2000,1999,1997
Download
Bibliothek der Globalstatistik →Macedonia, FYR →

Net bilateral aid flows from DAC donors, Spain (current US$)

Diese Statistik in anderen Ländern:

AfghanistanAlbaniaAlgeriaAngolaAntigua and BarbudaArab WorldArgentinaArmeniaAzerbaijanBangladeshBarbadosBelarusBelizeBeninBhutanBoliviaBosnia and HerzegovinaBotswanaBrazilBulgariaBurkina FasoBurundiCabo VerdeCambodiaCameroonCaribbean small statesCentral African RepublicCentral Europe and the BalticsChadChileChinaColombiaComorosCongo, Dem. Rep.Congo, Rep.Costa RicaCote d'IvoireCroatiaCubaCyprusCzech RepublicDjiboutiDominicaDominican RepublicEast Asia & PacificEast Asia & Pacific (excluding high income)East Asia & Pacific (IDA & IBRD countries)EcuadorEgypt, Arab Rep.El SalvadorEquatorial GuineaEritreaEstoniaEthiopiaEuro areaEurope & Central AsiaEurope & Central Asia (excluding high income)Europe & Central Asia (IDA & IBRD countries)European UnionFijiFragile and conflict affected situationsGabonGambia, TheGeorgiaGhanaGrenadaGuatemalaGuineaGuinea-BissauGuyanaHaitiHeavily indebted poor countries (HIPC)High incomeHondurasHong Kong SAR, ChinaHungaryIBRD onlyIDA & IBRD totalIDA blendIDA onlyIDA totalIndiaIndonesiaIran, Islamic Rep.IraqIsraelJamaicaJordanKazakhstanKenyaKorea, Dem. People’s Rep.Korea, Rep.KosovoKuwaitKyrgyz RepublicLao PDRLatin America & Caribbean Latin America & Caribbean (excluding high income)Latin America & the Caribbean (IDA & IBRD countries)LatviaLeast developed countries: UN classificationLebanonLesothoLiberiaLibyaLithuaniaLow & middle incomeLow incomeLower middle incomeMacedonia, FYRMadagascarMalawiMalaysiaMaldivesMaliMaltaMauritaniaMauritiusMexicoMicronesia, Fed. Sts.Middle East & North AfricaMiddle East & North Africa (excluding high income)Middle East & North Africa (IDA & IBRD countries)Middle incomeMoldovaMongoliaMontenegroMoroccoMozambiqueMyanmarNamibiaNepalNicaraguaNigerNigeriaOECD membersOmanOther small statesPacific island small statesPakistanPalauPanamaPapua New GuineaParaguayPeruPhilippinesPolandRomaniaRussian FederationRwandaSamoaSao Tome and PrincipeSaudi ArabiaSenegalSerbiaSeychellesSierra LeoneSingaporeSlovak RepublicSloveniaSmall statesSolomon IslandsSomaliaSouth AfricaSouth AsiaSouth Asia (IDA & IBRD)South SudanSri LankaSt. Kitts and NevisSt. LuciaSt. Vincent and the GrenadinesSub-Saharan Africa Sub-Saharan Africa (excluding high income)Sub-Saharan Africa (IDA & IBRD countries)SudanSurinameSwazilandSyrian Arab RepublicTajikistanTanzaniaThailandTimor-LesteTogoTongaTrinidad and TobagoTunisiaTurkeyTurkmenistanUgandaUkraineUnited Arab EmiratesUpper middle incomeUruguayUzbekistanVanuatuVenezuela, RBVietnamWest Bank and GazaWorldYemen, Rep.ZambiaZimbabwe

Zeitlinie:

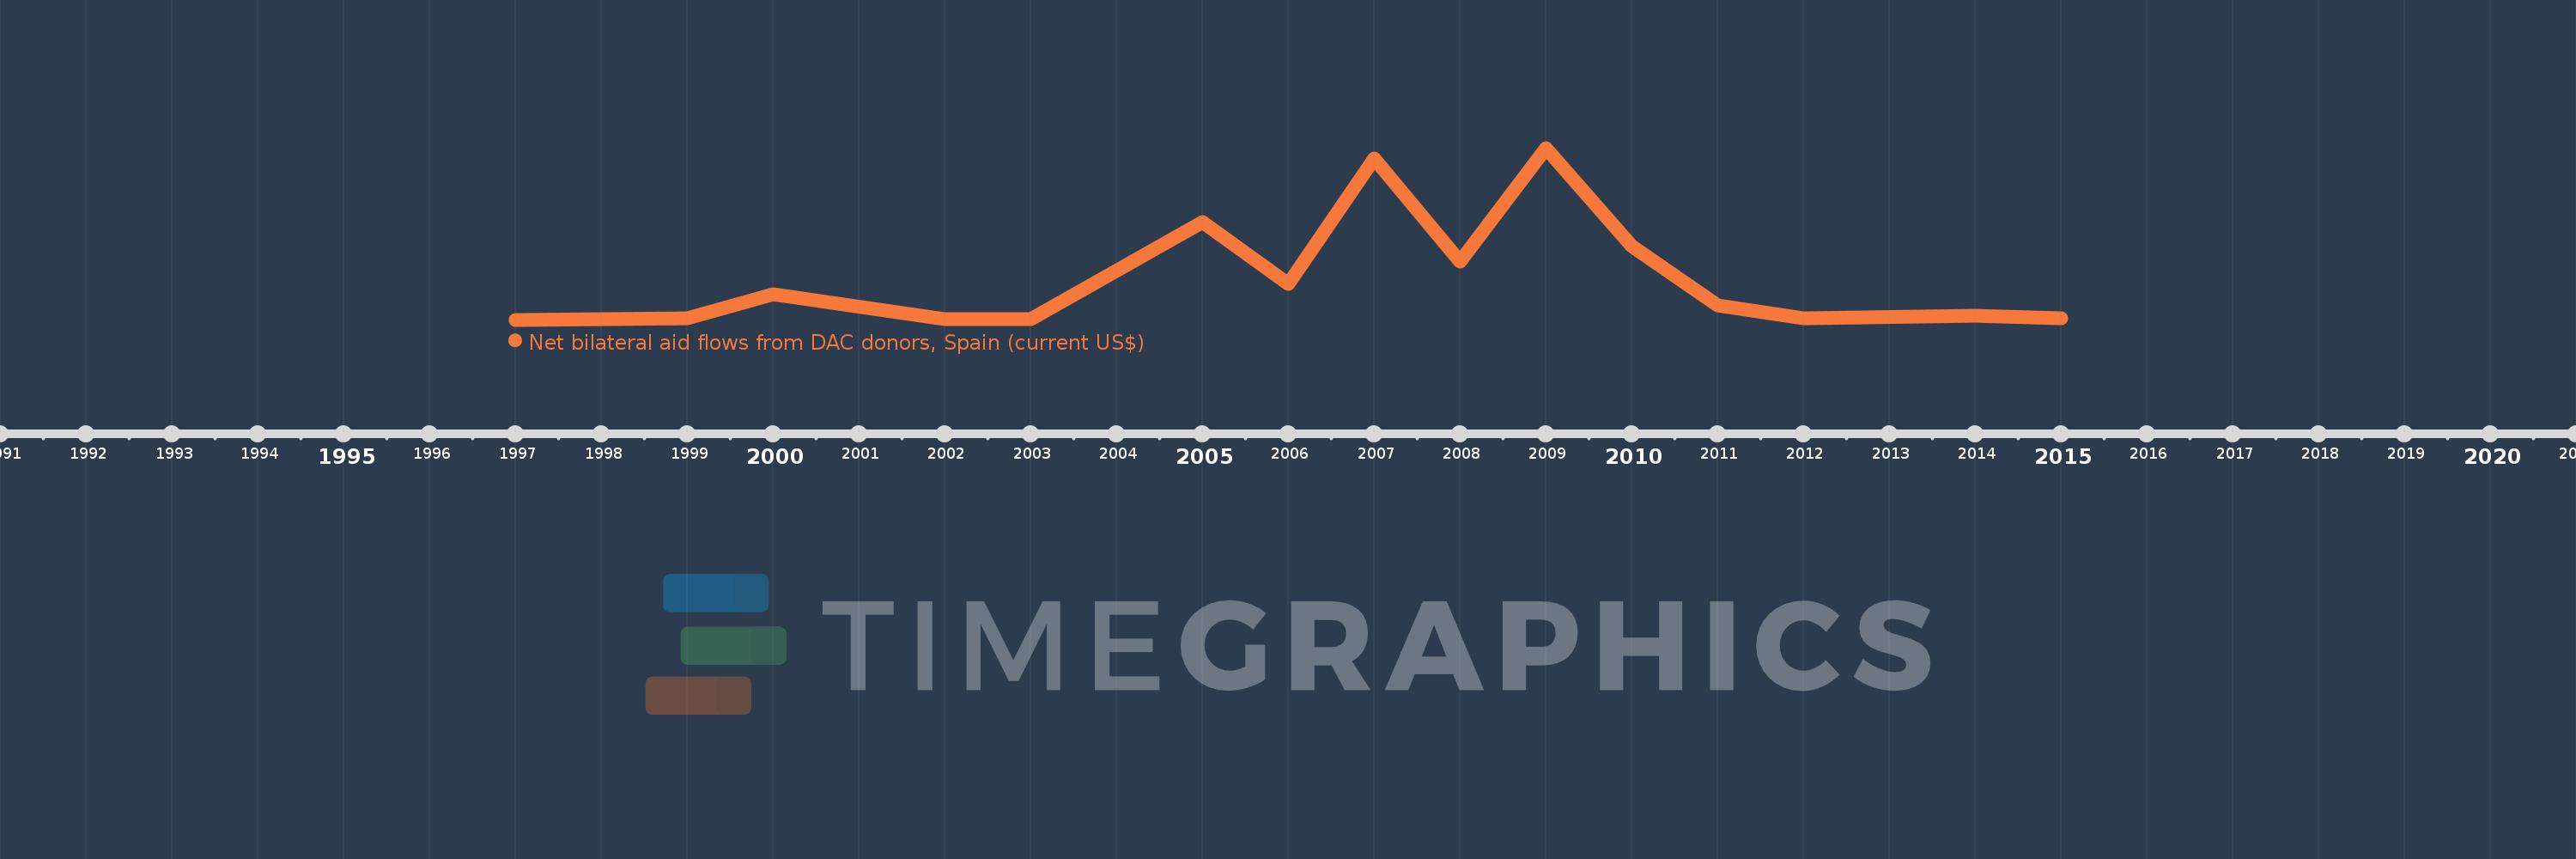
Diese Zeitleiste vorliegt die Graphik ab 1997 J. bis 2015 J. Macedonia, FYR. Die Angaben bis 1996 J. sind nicht vorhanden. Die Zahl aktueller Beobachtungen nach Daten: 15.

Die Quelle (Bezeichnung):

Kennzahlen der Weltentwicklung

Die Quelle (Einrichtung):

Development Assistance Committee of the Organisation for Economic Co-operation and Development, Geographical Distribution of Financial Flows to Developing Countries, Development Co-operation Report, and International Development Statistics database. Data are available online at: www.oecd.org/dac/stats/idsonline.

Kategorien:

Aid Effectiveness

Es wurde aktualisiert:

23 Apr 2017 Jahr

Kennzahlen der Wertänderungen vom Jahr zum Jahr

im Durchschnitt:
1.029 Mln.
Minimum:
10.0 Tsnd.
1 Jan 1997 Jahr
Maximum:
4.07 Mln.
1 Jan 2009 Jahr
Zum Datum der Beobachtung
Wert
Absolute Veränderung
Die Veränderung bezüglich dem vorherigen Wert
1 Jan 1997 Jahr
10.0 Tsnd.
+10.0 Tsnd.
0.0%
1 Jan 1999 Jahr
40.0 Tsnd.
+30.0 Tsnd.
300.0%
1 Jan 2000 Jahr
610.0 Tsnd.
+570.0 Tsnd.
1.43 Tsnd.%
1 Jan 2002 Jahr
20.0 Tsnd.
-590.0 Tsnd.
-96.72%
1 Jan 2003 Jahr
20.0 Tsnd.
0.0
0.0%
1 Jan 2005 Jahr
2.31 Mln.
+2.29 Mln.
11.45 Tsnd.%
1 Jan 2006 Jahr
850.0 Tsnd.
-1.46 Mln.
-63.2%
1 Jan 2007 Jahr
3.82 Mln.
+2.97 Mln.
349.41%
1 Jan 2008 Jahr
1.38 Mln.
-2.44 Mln.
-63.87%
1 Jan 2009 Jahr
4.07 Mln.
+2.69 Mln.
194.93%
1 Jan 2010 Jahr
1.75 Mln.
-2.32 Mln.
-57.0%
1 Jan 2011 Jahr
350.0 Tsnd.
-1.4 Mln.
-80.0%
1 Jan 2012 Jahr
50.0 Tsnd.
-300.0 Tsnd.
-85.71%
1 Jan 2014 Jahr
110.0 Tsnd.
+60.0 Tsnd.
120.0%
1 Jan 2015 Jahr
50.0 Tsnd.
-60.0 Tsnd.
-54.55%

Bewertung der Länder gemäß mit laufender Statistik nach Jahren