33
/de/
AIzaSyB4mHJ5NPEv-XzF7P6NDYXjlkCWaeKw5bc
November 30, 2025
182496
Luxembourg
LUX
true
2
1
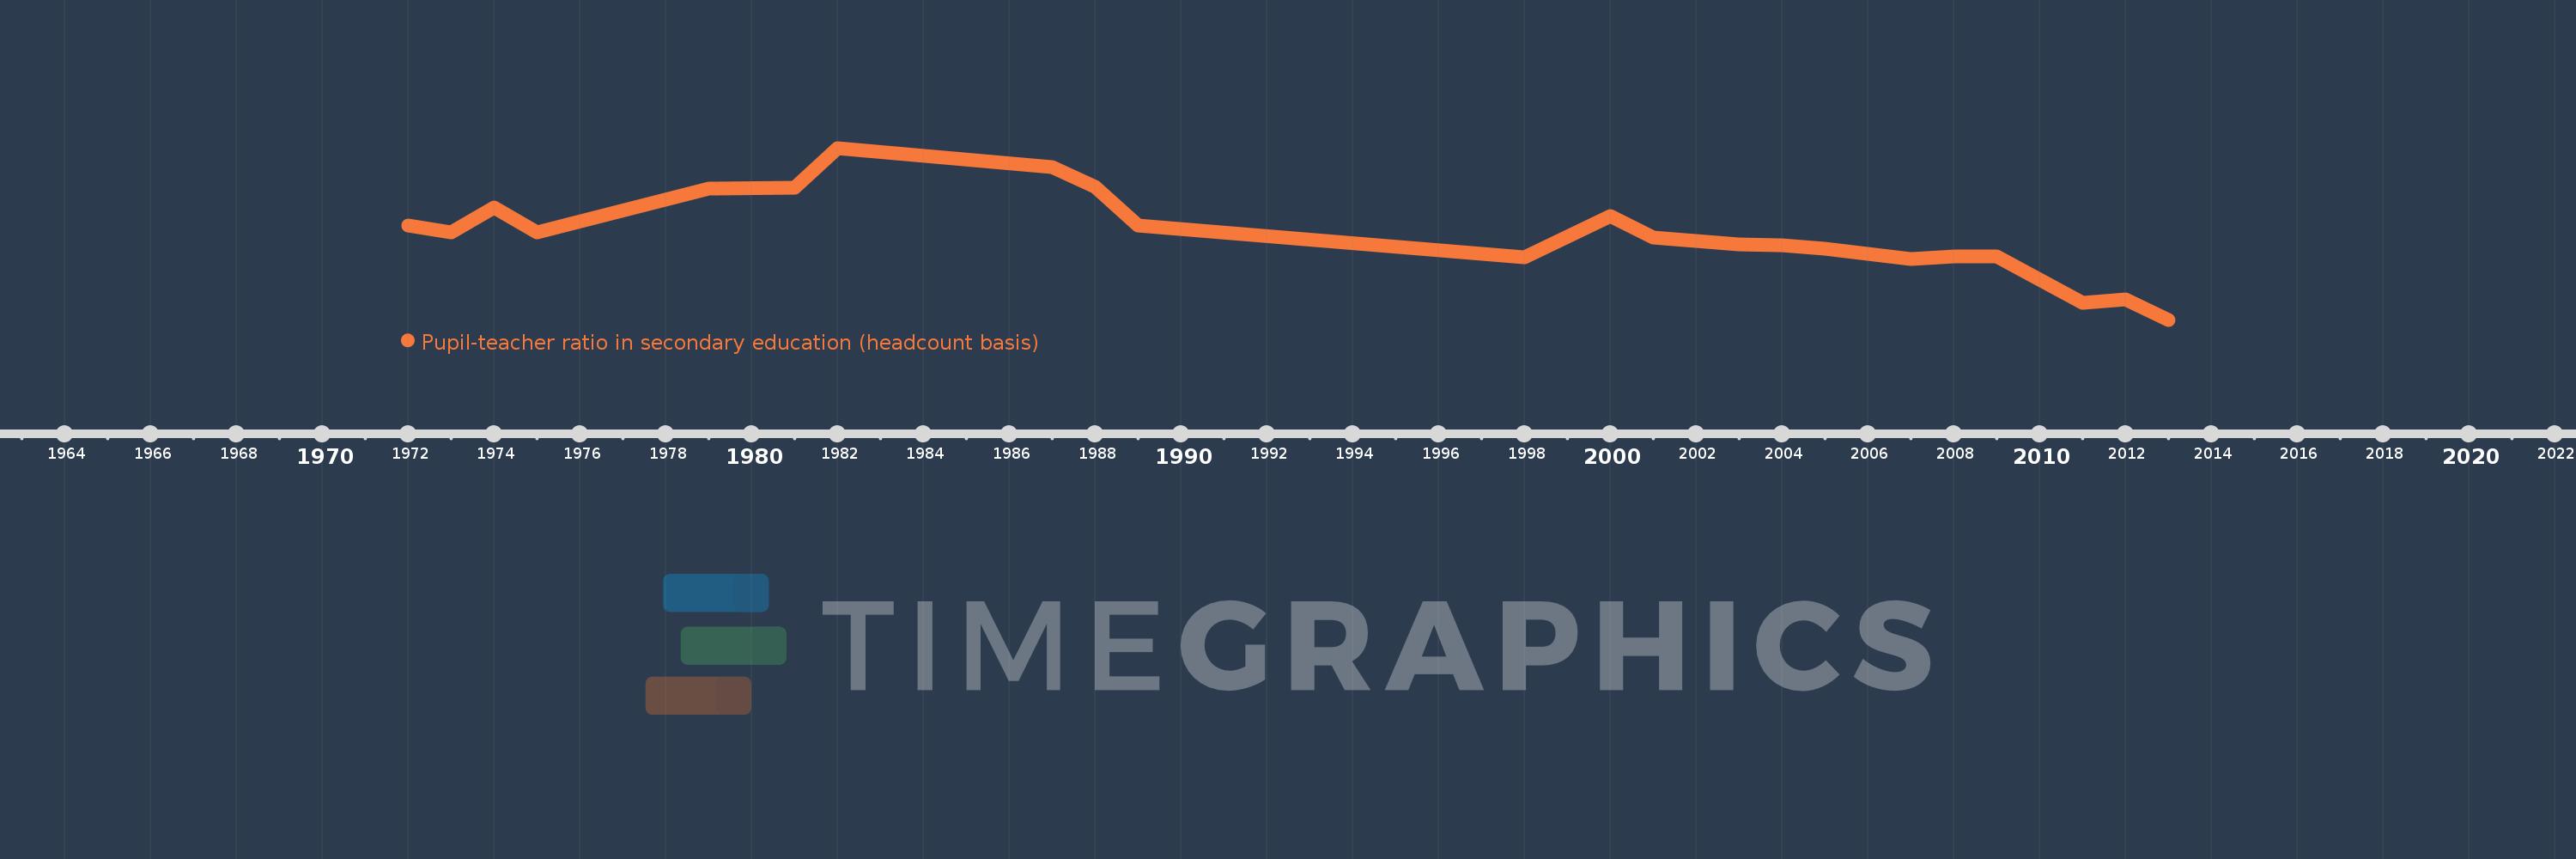
Pupil-teacher ratio in secondary education (headcount basis)
2013,2012,2011,2009,2008,2007,2006,2005,2004,2003,2002,2001,2000,1998,1989,1988,1987,1982,1981,1979,1975,1974,1973,1972