33
/de/
AIzaSyB4mHJ5NPEv-XzF7P6NDYXjlkCWaeKw5bc
November 30, 2025
182480
Luxembourg
LUX
true
2
1
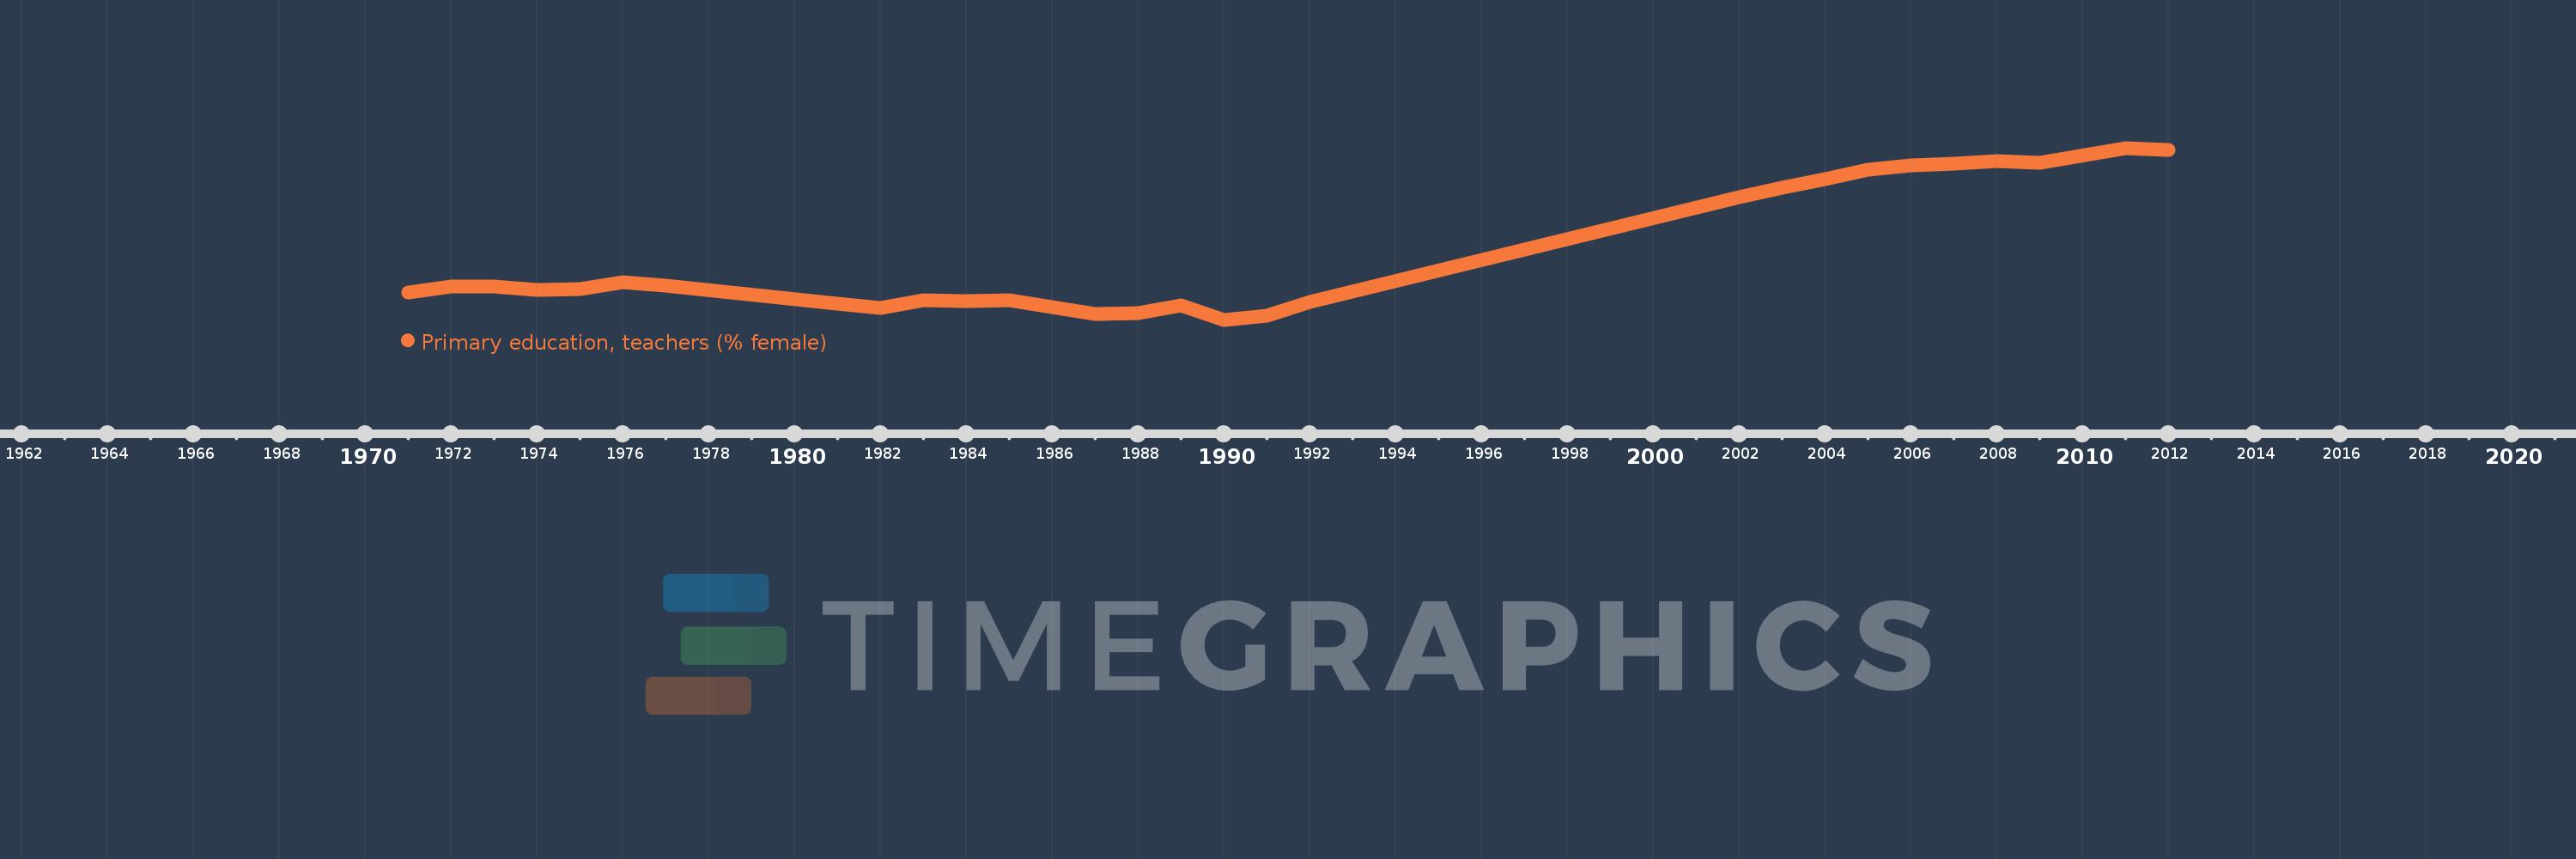
Primary education, teachers (% female)
2012,2011,2009,2008,2007,2006,2005,2004,2003,2002,1992,1991,1990,1989,1988,1987,1985,1984,1983,1982,1981,1977,1976,1975,1974,1973,1972,1971