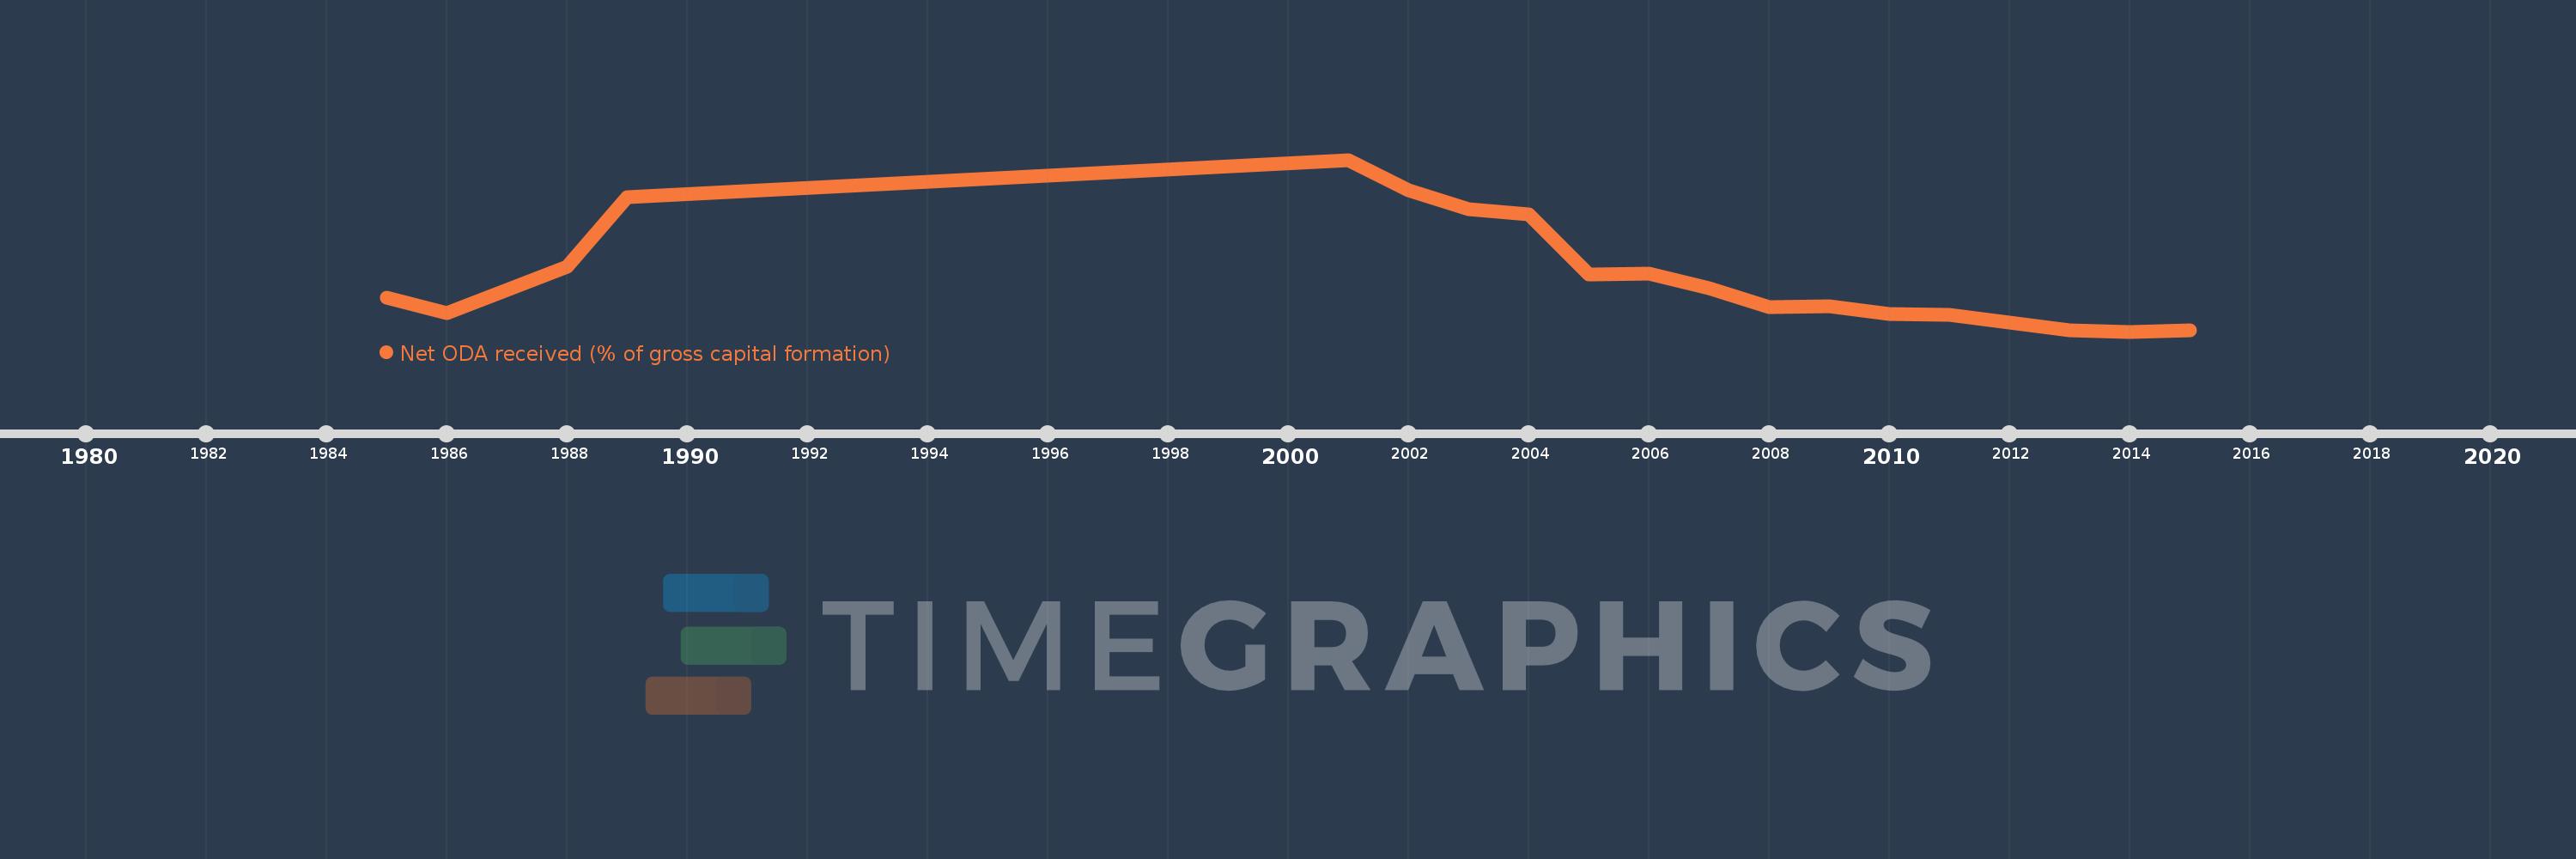
Diese Zeitleiste vorliegt die Graphik ab 1985 J. bis 2015 J. Lao PDR. Die Angaben bis 1984 J. sind nicht vorhanden. Die Zahl aktueller Beobachtungen nach Daten: 20.
Die Quelle (Bezeichnung):
Kennzahlen der Weltentwicklung
Die Quelle (Einrichtung):
Development Assistance Committee of the Organisation for Economic Co-operation and Development, Geographical Distribution of Financial Flows to Developing Countries, Development Co-operation Report, and International Development Statistics database. Data are available online at: www.oecd.org/dac/stats/idsonline. World Bank gross capital formation estimates are used for the denominator.
Kategorien:
Aid Effectiveness
Es wurde aktualisiert:
23 Apr 2017 Jahr
Kennzahlen der Wertänderungen vom Jahr zum Jahr
im Durchschnitt:
46.042
Minimum:
12.907
1 Jan 2014 Jahr
Maximum:
116.378
1 Jan 2001 Jahr
Zum Datum der Beobachtung
Wert
Absolute Veränderung
Die Veränderung bezüglich dem vorherigen Wert
1 Jan 1985 Jahr
33.139
+33.139
0.0%
1 Jan 1986 Jahr
23.796
-9.343
-28.19%
1 Jan 1987 Jahr
37.911
+14.115
59.32%
1 Jan 1988 Jahr
51.714
+13.803
36.41%
1 Jan 1989 Jahr
93.761
+42.048
81.31%
1 Jan 2001 Jahr
116.378
+22.617
24.12%
1 Jan 2002 Jahr
98.221
-18.157
-15.6%
1 Jan 2003 Jahr
86.783
-11.438
-11.65%
1 Jan 2004 Jahr
83.758
-3.025
-3.49%
1 Jan 2005 Jahr
47.431
-36.327
-43.37%
1 Jan 2006 Jahr
47.833
+0.402
0.85%
1 Jan 2007 Jahr
38.925
-8.908
-18.62%
1 Jan 2008 Jahr
27.516
-11.409
-29.31%
1 Jan 2009 Jahr
28.332
+0.816
2.96%
1 Jan 2010 Jahr
23.718
-4.615
-16.29%
1 Jan 2011 Jahr
23.216
-0.502
-2.12%
1 Jan 2012 Jahr
18.21
-5.006
-21.56%
1 Jan 2013 Jahr
13.833
-4.377
-24.04%
1 Jan 2014 Jahr
12.907
-0.925
-6.69%
1 Jan 2015 Jahr
13.463
+0.555
4.3%
Bewertung der Länder gemäß mit laufender Statistik nach Jahren