29
/de/
de
AIzaSyAYiBZKx7MnpbEhh9jyipgxe19OcubqV5w
April 1, 2024
173170
Kyrgyz Republic
KGZ
true
2
1
Natural gas rents (% of GDP)
2016,2015,2014,2013,2012,2011,2010,2009,2008,2007,2006,2005,2004,2003,2002,2001,2000,1999,1998,1997,1996,1995,1994,1993,1992,1991
Download
Bibliothek der Globalstatistik →Kyrgyz Republic →

Natural gas rents (% of GDP)

Diese Statistik in anderen Ländern:
AfghanistanAlbaniaAlgeriaAngolaArab WorldArgentinaArmeniaAustraliaAustriaAzerbaijanBahrainBangladeshBarbadosBelarusBelgiumBelizeBeninBoliviaBosnia and HerzegovinaBotswanaBrazilBrunei DarussalamBulgariaCambodiaCameroonCanadaCaribbean small statesCentral Europe and the BalticsChadChileChinaColombiaCongo, Dem. Rep.Congo, Rep.Costa RicaCote d'IvoireCroatiaCubaCyprusCzech RepublicDenmarkDominican RepublicEarly-demographic dividendEast Asia & PacificEast Asia & Pacific (excluding high income)East Asia & Pacific (IDA & IBRD countries)EcuadorEgypt, Arab Rep.El SalvadorEquatorial GuineaEritreaEstoniaEthiopiaEuro areaEurope & Central AsiaEurope & Central Asia (excluding high income)Europe & Central Asia (IDA & IBRD countries)European UnionFinlandFragile and conflict affected situationsFranceGabonGeorgiaGermanyGhanaGreeceGuatemalaHaitiHeavily indebted poor countries (HIPC)High incomeHondurasHungaryIBRD onlyIcelandIDA & IBRD totalIDA blendIDA onlyIDA totalIndiaIndonesiaIran, Islamic Rep.IraqIrelandIsraelItalyJamaicaJapanJordanKazakhstanKenyaKorea, Rep.KosovoKuwaitKyrgyz RepublicLate-demographic dividendLatin America & Caribbean Latin America & Caribbean (excluding high income)Latin America & the Caribbean (IDA & IBRD countries)LatviaLeast developed countries: UN classificationLebanonLibyaLithuaniaLow & middle incomeLow incomeLower middle incomeLuxembourgMacedonia, FYRMalaysiaMaltaMauritiusMexicoMiddle East & North AfricaMiddle East & North Africa (excluding high income)Middle East & North Africa (IDA & IBRD countries)Middle incomeMoldovaMongoliaMontenegroMoroccoMozambiqueMyanmarNamibiaNepalNetherlandsNew ZealandNicaraguaNigerNigeriaNorth AmericaNorwayOECD membersOmanOther small statesPakistanPanamaPapua New GuineaParaguayPeruPhilippinesPolandPortugalPost-demographic dividendPre-demographic dividendQatarRomaniaRussian FederationSaudi ArabiaSenegalSerbiaSingaporeSlovak RepublicSloveniaSmall statesSouth AfricaSouth AsiaSouth Asia (IDA & IBRD)South SudanSpainSri LankaSub-Saharan Africa Sub-Saharan Africa (excluding high income)Sub-Saharan Africa (IDA & IBRD countries)SudanSwedenSwitzerlandSyrian Arab RepublicTajikistanTanzaniaThailandTimor-LesteTogoTrinidad and TobagoTunisiaTurkeyTurkmenistanUkraineUnited Arab EmiratesUnited KingdomUnited StatesUpper middle incomeUruguayUzbekistanVenezuela, RBVietnamWest Bank and GazaWorldYemen, Rep.ZambiaZimbabwe
Zeitlinie:
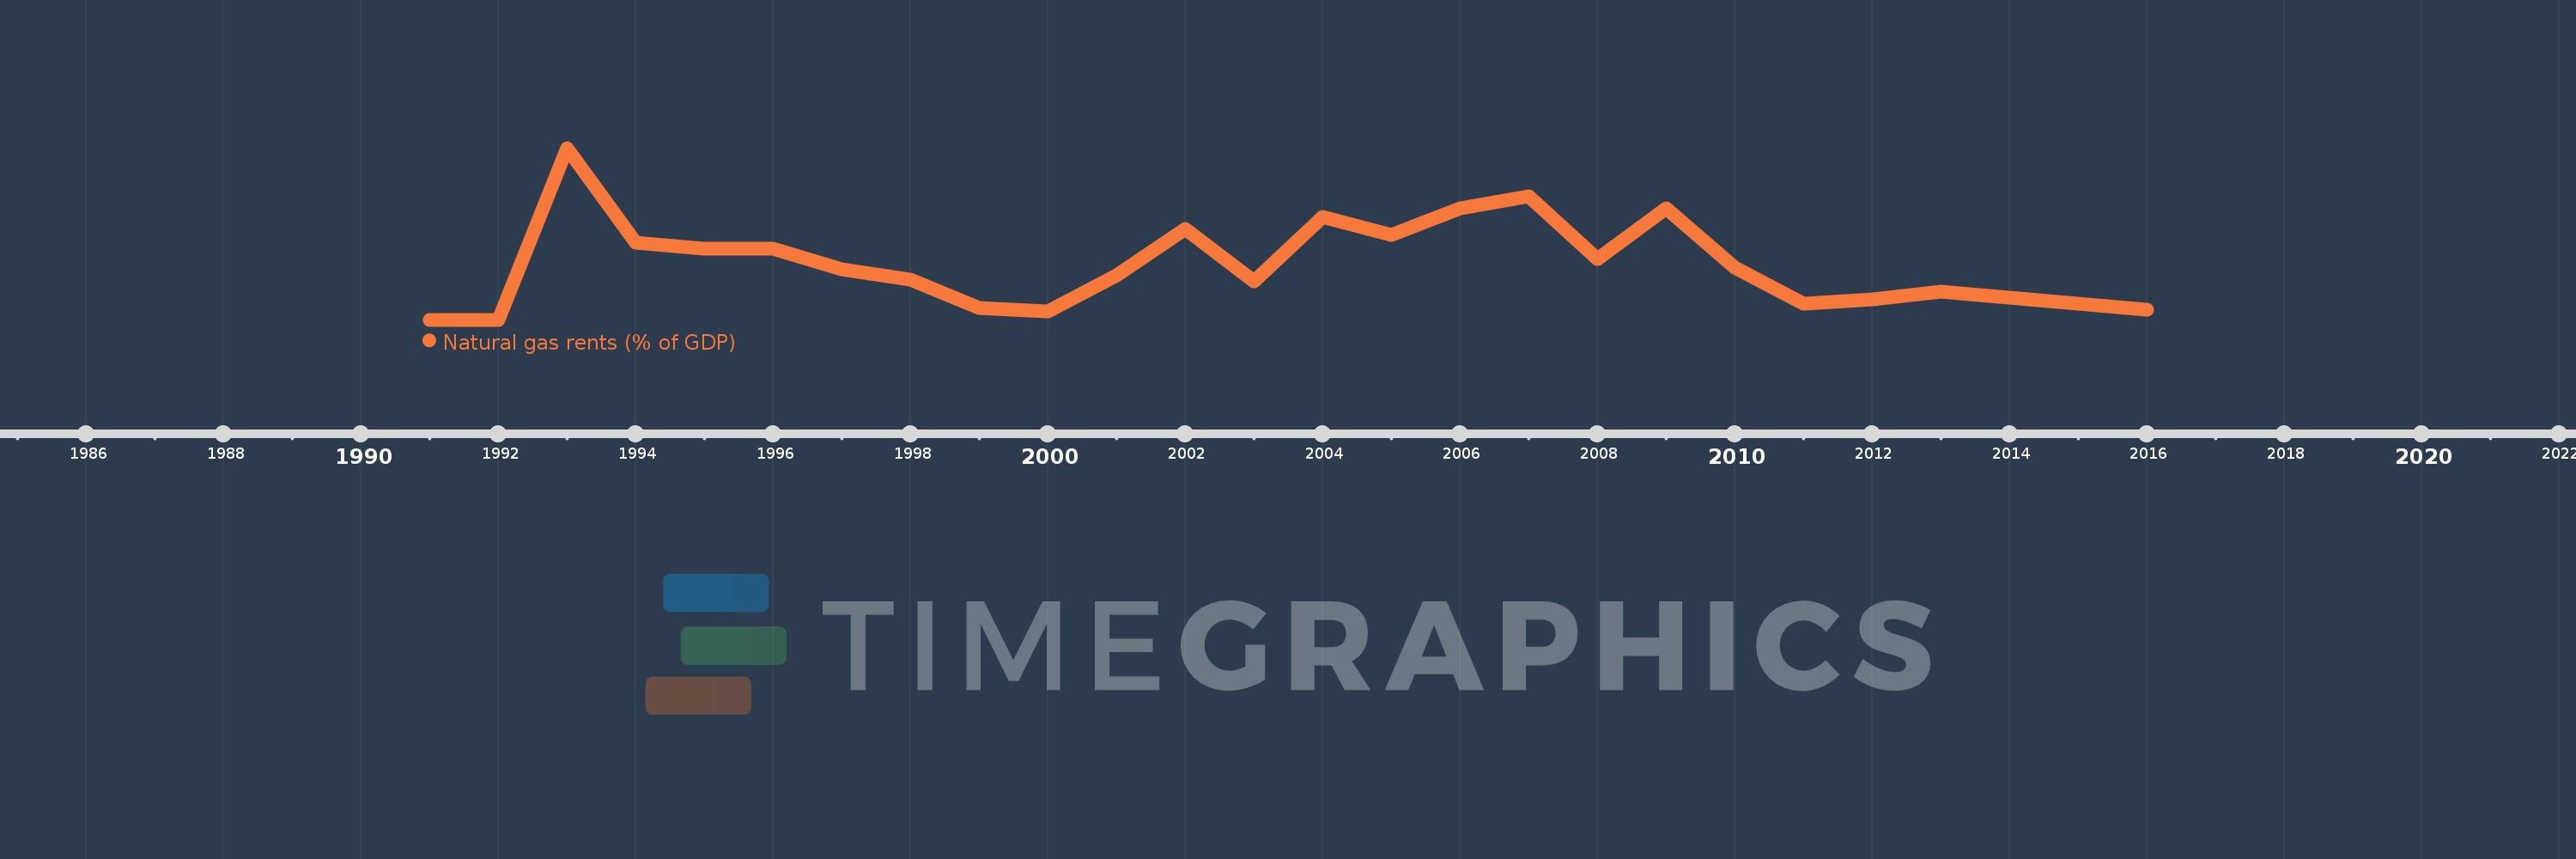
Diese Zeitleiste vorliegt die Graphik ab 1991 J. bis 2016 J. Kyrgyz Republic. Die Angaben bis 1990 J. sind nicht vorhanden. Die Zahl aktueller Beobachtungen nach Daten: 26.
Die Quelle (Bezeichnung):
Kennzahlen der Weltentwicklung
Die Quelle (Einrichtung):
Estimates based on sources and methods described in "The Changing Wealth of Nations: Measuring Sustainable Development in the New Millennium" (World Bank, 2011).
Kategorien:
Energy & Mining, Environment
Es wurde aktualisiert:
23 Apr 2017 Jahr
Kennzahlen der Wertänderungen vom Jahr zum Jahr
im Durchschnitt:
0.03
Minimum:
0.003
1 Jan 1992 Jahr
Maximum:
0.088
1 Jan 1993 Jahr
Zum Datum der Beobachtung
Wert
Absolute Veränderung
Die Veränderung bezüglich dem vorherigen Wert
1 Jan 1991 Jahr
0.003
+0.003
0.0%
1 Jan 1992 Jahr
0.003
0.0
-10.88%
1 Jan 1993 Jahr
0.088
+0.085
3.06 Tsnd.%
1 Jan 1994 Jahr
0.041
-0.047
-53.45%
1 Jan 1995 Jahr
0.038
-0.003
-6.47%
1 Jan 1996 Jahr
0.038
0.0
-0.29%
1 Jan 1997 Jahr
0.028
-0.01
-25.71%
1 Jan 1998 Jahr
0.023
-0.006
-19.57%
1 Jan 1999 Jahr
0.009
-0.014
-61.15%
1 Jan 2000 Jahr
0.007
-0.002
-20.36%
1 Jan 2001 Jahr
0.025
+0.018
254.44%
1 Jan 2002 Jahr
0.048
+0.023
92.69%
1 Jan 2003 Jahr
0.022
-0.026
-55.01%
1 Jan 2004 Jahr
0.054
+0.033
151.04%
1 Jan 2005 Jahr
0.045
-0.009
-16.45%
1 Jan 2006 Jahr
0.058
+0.012
27.07%
1 Jan 2007 Jahr
0.064
+0.006
11.2%
1 Jan 2008 Jahr
0.033
-0.031
-48.45%
1 Jan 2009 Jahr
0.058
+0.025
76.78%
1 Jan 2010 Jahr
0.029
-0.029
-50.0%
1 Jan 2011 Jahr
0.011
-0.018
-62.64%
1 Jan 2012 Jahr
0.013
+0.002
17.84%
1 Jan 2013 Jahr
0.017
+0.005
35.79%
1 Jan 2014 Jahr
0.014
-0.004
-20.19%
1 Jan 2015 Jahr
0.011
-0.003
-19.48%
1 Jan 2016 Jahr
0.008
-0.003
-28.95%
Bewertung der Länder gemäß mit laufender Statistik nach Jahren

Kommentare:

Abschicken
PremiumAbout & FeedbackVereinbarungPrivatheit
logo
© 2022 Selected Technologies LLC – Morgan Hill, California