30
/de/
AIzaSyAYiBZKx7MnpbEhh9jyipgxe19OcubqV5w
April 1, 2024
172381
Kyrgyz Republic
KGZ
true
2
1
Adjusted net national income per capita (constant 2010 US$)
2015,2014,2013,2012,2011,2010,2009,2008,2007,2006,2005,2004,2003,2002,2001,2000,1999,1998
Download
Bibliothek der Globalstatistik →Kyrgyz Republic →

Adjusted net national income per capita (constant 2010 US$)

Diese Statistik in anderen Ländern:

AfghanistanAlbaniaAlgeriaAngolaArab WorldArgentinaArmeniaAustraliaAustriaAzerbaijanBahamas, TheBahrainBangladeshBarbadosBelarusBelgiumBelizeBeninBhutanBoliviaBotswanaBrazilBulgariaBurkina FasoBurundiCabo VerdeCambodiaCameroonCanadaCaribbean small statesCentral African RepublicCentral Europe and the BalticsChadChileChinaColombiaComorosCongo, Dem. Rep.Congo, Rep.Costa RicaCote d'IvoireCroatiaCubaCyprusCzech RepublicDenmarkDominicaDominican RepublicEarly-demographic dividendEast Asia & PacificEast Asia & Pacific (excluding high income)East Asia & Pacific (IDA & IBRD countries)EcuadorEgypt, Arab Rep.El SalvadorEritreaEstoniaEthiopiaEuro areaEurope & Central AsiaEurope & Central Asia (excluding high income)Europe & Central Asia (IDA & IBRD countries)European UnionFijiFinlandFragile and conflict affected situationsFranceGabonGambia, TheGeorgiaGermanyGhanaGreeceGuatemalaGuineaGuinea-BissauGuyanaHaitiHeavily indebted poor countries (HIPC)High incomeHondurasHungaryIBRD onlyIDA & IBRD totalIDA blendIDA onlyIDA totalIndiaIndonesiaIran, Islamic Rep.IraqIrelandIsraelItalyJamaicaJapanJordanKazakhstanKenyaKiribatiKorea, Rep.KuwaitKyrgyz RepublicLao PDRLate-demographic dividendLatin America & Caribbean Latin America & Caribbean (excluding high income)Latin America & the Caribbean (IDA & IBRD countries)LatviaLeast developed countries: UN classificationLebanonLesothoLiberiaLibyaLithuaniaLow & middle incomeLow incomeLower middle incomeLuxembourgMacedonia, FYRMadagascarMalawiMalaysiaMaldivesMaliMauritaniaMauritiusMexicoMiddle East & North AfricaMiddle East & North Africa (excluding high income)Middle East & North Africa (IDA & IBRD countries)Middle incomeMoldovaMongoliaMoroccoMozambiqueNamibiaNepalNetherlandsNew ZealandNicaraguaNigerNigeriaNorth AmericaNorwayOECD membersOmanOther small statesPacific island small statesPakistanPanamaPapua New GuineaParaguayPeruPhilippinesPolandPortugalPost-demographic dividendPre-demographic dividendQatarRomaniaRussian FederationRwandaSamoaSao Tome and PrincipeSaudi ArabiaSenegalSeychellesSierra LeoneSingaporeSlovak RepublicSloveniaSmall statesSolomon IslandsSouth AfricaSouth AsiaSouth Asia (IDA & IBRD)SpainSri LankaSt. LuciaSt. Vincent and the GrenadinesSub-Saharan Africa Sub-Saharan Africa (excluding high income)Sub-Saharan Africa (IDA & IBRD countries)SurinameSwazilandSwedenSwitzerlandTajikistanTanzaniaThailandTogoTongaTrinidad and TobagoTunisiaTurkeyTurkmenistanUgandaUkraineUnited Arab EmiratesUnited KingdomUnited StatesUpper middle incomeUruguayUzbekistanVanuatuVenezuela, RBVietnamWorldYemen, Rep.ZambiaZimbabwe

Zeitlinie:

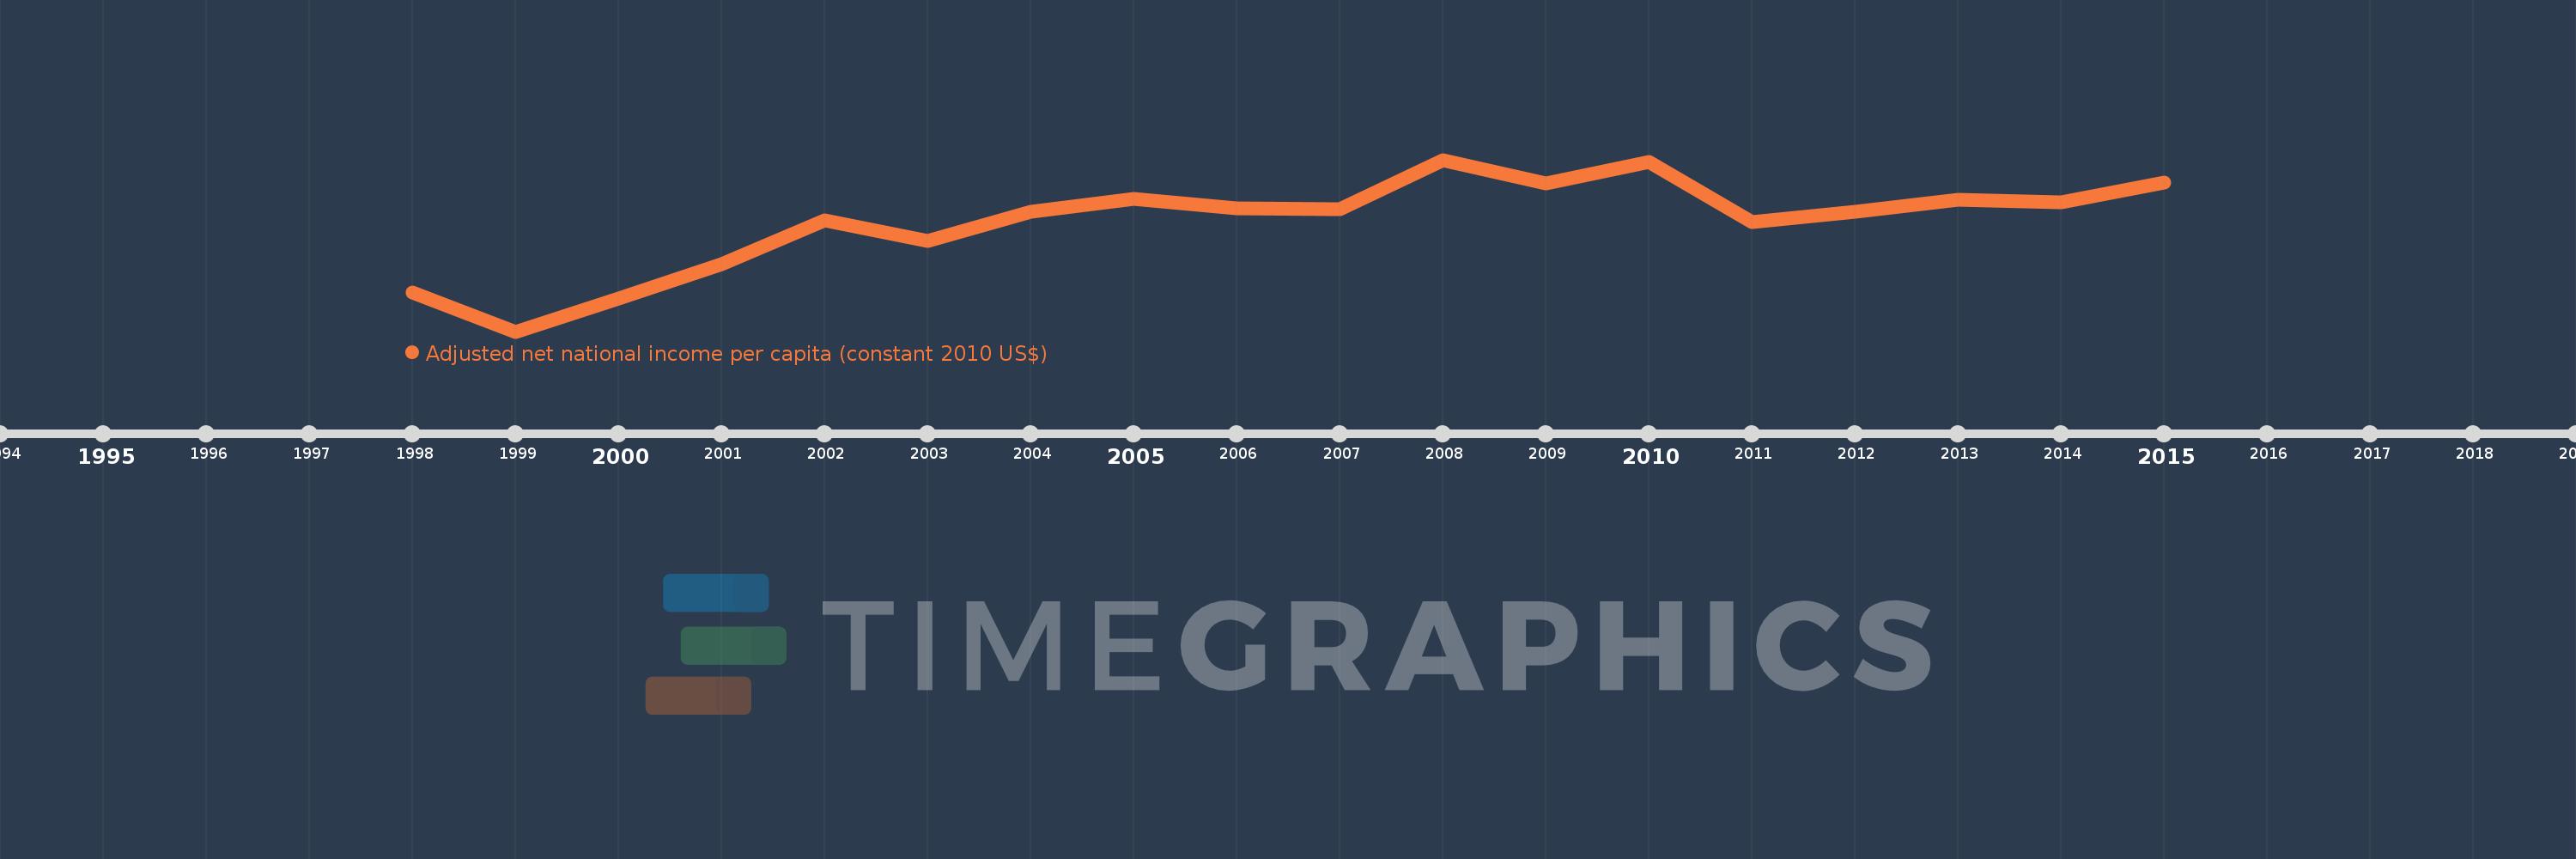
Diese Zeitleiste vorliegt die Graphik ab 1998 J. bis 2015 J. Kyrgyz Republic. Die Angaben bis 1997 J. sind nicht vorhanden. Die Zahl aktueller Beobachtungen nach Daten: 18.

Die Quelle (Bezeichnung):

Kennzahlen der Weltentwicklung

Die Quelle (Einrichtung):

NULWorld Bank staff estimates based on sources and methods in World Bank's "The Changing Wealth of Nations: Measuring Sustainable Development in the New Millennium" (2011).L

Kategorien:

Economy & Growth

Es wurde aktualisiert:

23 Apr 2017 Jahr

Kennzahlen der Wertänderungen vom Jahr zum Jahr

im Durchschnitt:
659.225
Minimum:
493.436
1 Jan 1999 Jahr
Maximum:
753.88
1 Jan 2008 Jahr
Zum Datum der Beobachtung
Wert
Absolute Veränderung
Die Veränderung bezüglich dem vorherigen Wert
1 Jan 1998 Jahr
552.617
+552.617
0.0%
1 Jan 1999 Jahr
493.436
-59.182
-10.71%
1 Jan 2000 Jahr
543.821
+50.385
10.21%
1 Jan 2001 Jahr
595.013
+51.192
9.41%
1 Jan 2002 Jahr
662.545
+67.532
11.35%
1 Jan 2003 Jahr
631.005
-31.54
-4.76%
1 Jan 2004 Jahr
675.431
+44.426
7.04%
1 Jan 2005 Jahr
694.749
+19.318
2.86%
1 Jan 2006 Jahr
680.262
-14.487
-2.09%
1 Jan 2007 Jahr
679.289
-0.973
-0.14%
1 Jan 2008 Jahr
753.88
+74.591
10.98%
1 Jan 2009 Jahr
718.049
-35.831
-4.75%
1 Jan 2010 Jahr
750.529
+32.48
4.52%
1 Jan 2011 Jahr
659.817
-90.713
-12.09%
1 Jan 2012 Jahr
674.469
+14.652
2.22%
1 Jan 2013 Jahr
693.311
+18.842
2.79%
1 Jan 2014 Jahr
689.085
-4.225
-0.61%
1 Jan 2015 Jahr
718.741
+29.656
4.3%

Bewertung der Länder gemäß mit laufender Statistik nach Jahren