29
/de/
de
AIzaSyAYiBZKx7MnpbEhh9jyipgxe19OcubqV5w
April 1, 2024
165021
Jordan
JOR
true
2
1
International tourism, receipts (% of total exports)
2015,2014,2013,2012,2011,2010,2009,2008,2007,2006,2005,2004,2003,2002,2001,2000,1999,1998,1997,1996
Download
Bibliothek der Globalstatistik →Jordan →

International tourism, receipts (% of total exports)

Diese Statistik in anderen Ländern:
AfghanistanAlbaniaAlgeriaAngolaAntigua and BarbudaArab WorldArgentinaArmeniaArubaAustraliaAustriaAzerbaijanBahamas, TheBahrainBangladeshBarbadosBelarusBelgiumBelizeBeninBermudaBhutanBoliviaBosnia and HerzegovinaBotswanaBrazilBrunei DarussalamBulgariaBurkina FasoBurundiCabo VerdeCambodiaCameroonCanadaCaribbean small statesCentral Europe and the BalticsChileChinaColombiaComorosCongo, Dem. Rep.Congo, Rep.Costa RicaCote d'IvoireCroatiaCuracaoCyprusCzech RepublicDenmarkDjiboutiDominicaDominican RepublicEarly-demographic dividendEast Asia & PacificEast Asia & Pacific (excluding high income)East Asia & Pacific (IDA & IBRD countries)EcuadorEgypt, Arab Rep.El SalvadorEquatorial GuineaEritreaEstoniaEthiopiaEuro areaEurope & Central AsiaEurope & Central Asia (excluding high income)Europe & Central Asia (IDA & IBRD countries)European UnionFijiFinlandFragile and conflict affected situationsFranceFrench PolynesiaGabonGambia, TheGeorgiaGermanyGhanaGreeceGrenadaGuatemalaGuineaGuinea-BissauGuyanaHaitiHeavily indebted poor countries (HIPC)High incomeHondurasHong Kong SAR, ChinaHungaryIBRD onlyIcelandIDA & IBRD totalIDA blendIDA onlyIDA totalIndiaIndonesiaIran, Islamic Rep.IraqIrelandIsraelItalyJamaicaJapanJordanKazakhstanKenyaKiribatiKorea, Rep.KuwaitKyrgyz RepublicLao PDRLate-demographic dividendLatin America & Caribbean Latin America & Caribbean (excluding high income)Latin America & the Caribbean (IDA & IBRD countries)LatviaLeast developed countries: UN classificationLebanonLesothoLiberiaLibyaLithuaniaLow & middle incomeLow incomeLower middle incomeLuxembourgMacao SAR, ChinaMacedonia, FYRMadagascarMalawiMalaysiaMaldivesMaliMaltaMarshall IslandsMauritaniaMauritiusMexicoMicronesia, Fed. Sts.Middle East & North AfricaMiddle East & North Africa (excluding high income)Middle East & North Africa (IDA & IBRD countries)Middle incomeMoldovaMongoliaMontenegroMoroccoMozambiqueMyanmarNamibiaNepalNetherlandsNew CaledoniaNicaraguaNigerNigeriaNorth AmericaNorwayOECD membersOmanOther small statesPacific island small statesPakistanPalauPanamaPapua New GuineaParaguayPeruPhilippinesPolandPortugalPost-demographic dividendPre-demographic dividendQatarRomaniaRussian FederationRwandaSamoaSao Tome and PrincipeSaudi ArabiaSenegalSerbiaSeychellesSierra LeoneSingaporeSint Maarten (Dutch part)Slovak RepublicSloveniaSmall statesSolomon IslandsSouth AfricaSouth AsiaSouth Asia (IDA & IBRD)SpainSri LankaSt. Kitts and NevisSt. LuciaSt. Vincent and the GrenadinesSub-Saharan Africa Sub-Saharan Africa (excluding high income)Sub-Saharan Africa (IDA & IBRD countries)SudanSurinameSwazilandSwedenSwitzerlandSyrian Arab RepublicTajikistanTanzaniaThailandTimor-LesteTogoTongaTrinidad and TobagoTunisiaTurkeyTuvaluUgandaUkraineUnited KingdomUnited StatesUpper middle incomeUruguayVanuatuVenezuela, RBVietnamWest Bank and GazaWorldYemen, Rep.ZambiaZimbabwe
Zeitlinie:
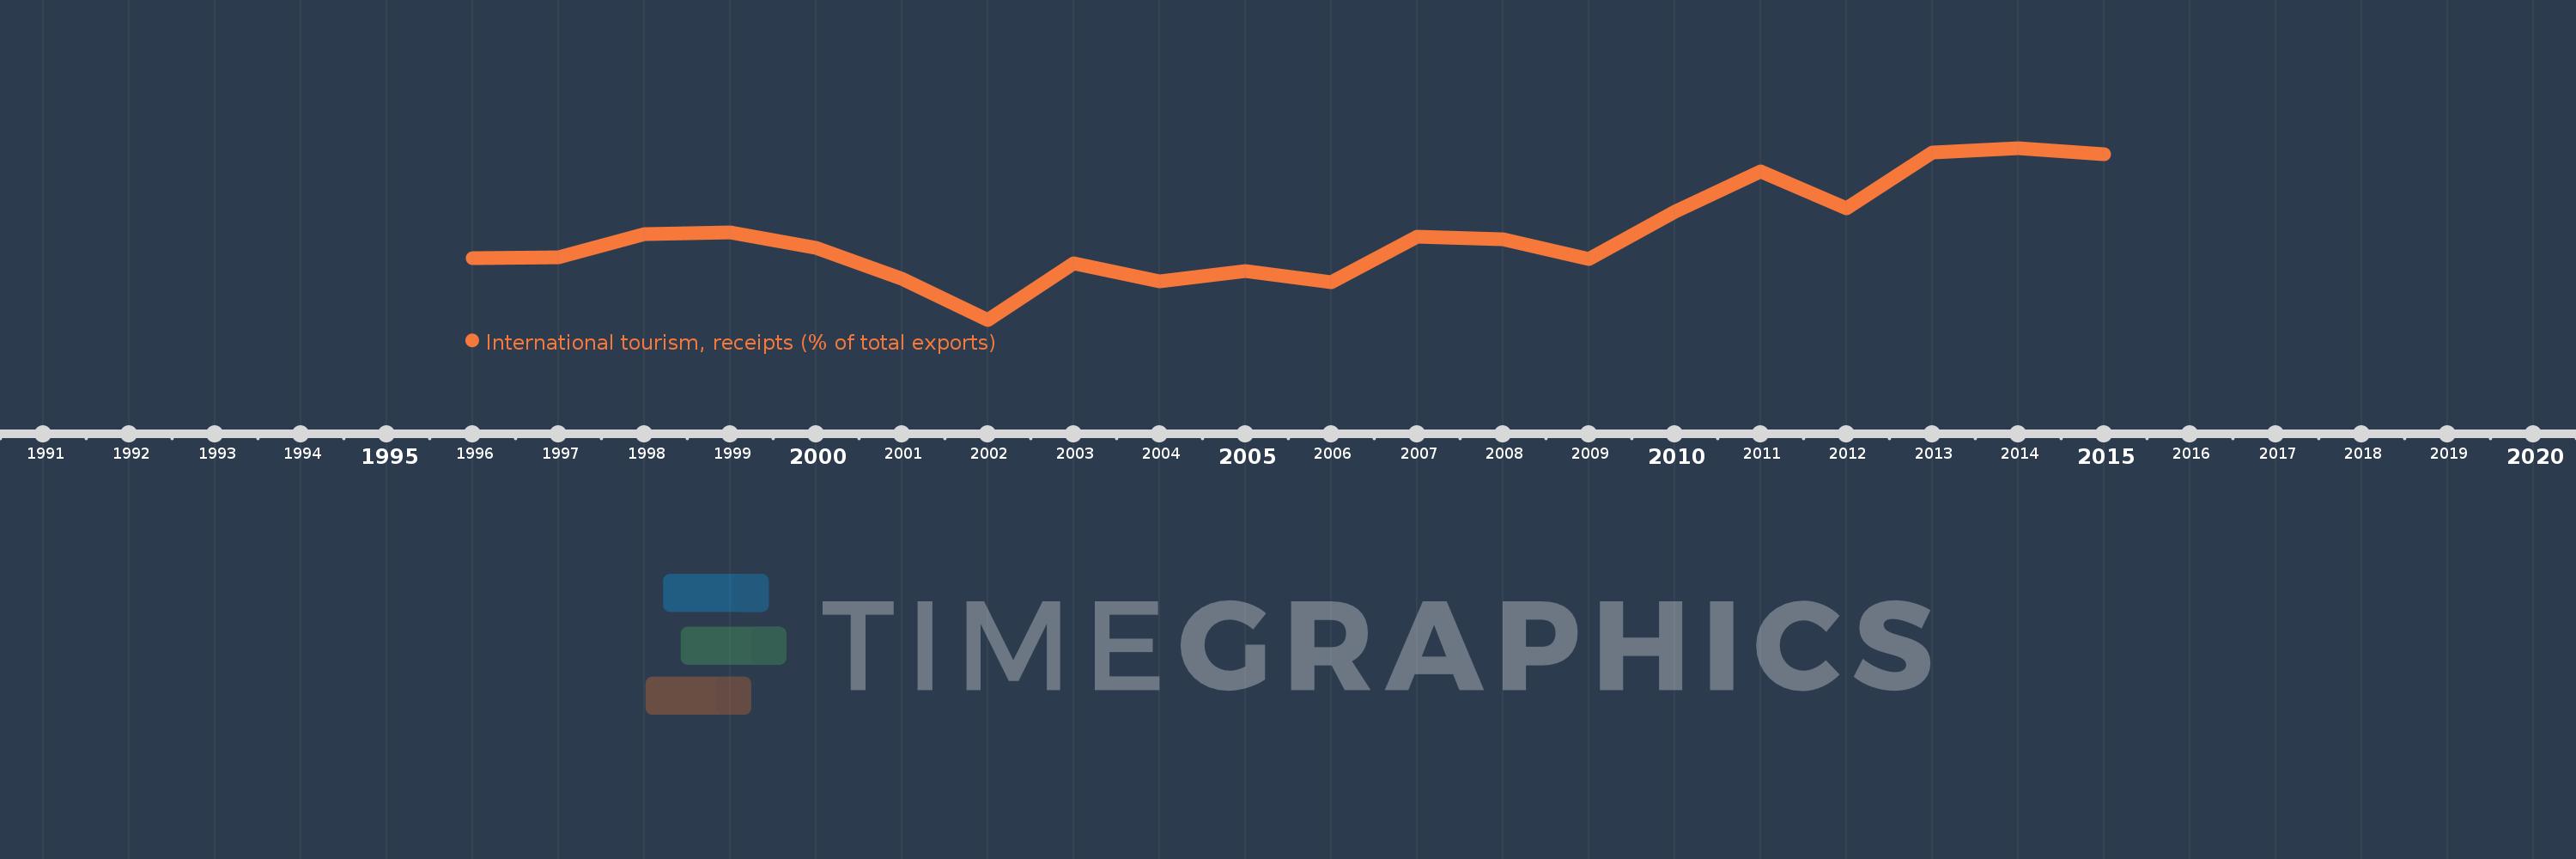
Diese Zeitleiste vorliegt die Graphik ab 1996 J. bis 2015 J. Jordan. Die Angaben bis 1995 J. sind nicht vorhanden. Die Zahl aktueller Beobachtungen nach Daten: 20.
Die Quelle (Bezeichnung):
Kennzahlen der Weltentwicklung
Die Quelle (Einrichtung):
World Tourism Organization, Yearbook of Tourism Statistics, Compendium of Tourism Statistics and data files, and IMF and World Bank exports estimates.
Kategorien:
Private Sector, Trade
Es wurde aktualisiert:
23 Apr 2017 Jahr
Kennzahlen der Wertänderungen vom Jahr zum Jahr
im Durchschnitt:
29.651
Minimum:
23.374
1 Jan 2002 Jahr
Maximum:
36.162
1 Jan 2014 Jahr
Zum Datum der Beobachtung
Wert
Absolute Veränderung
Die Veränderung bezüglich dem vorherigen Wert
1 Jan 1996 Jahr
27.97
+27.97
0.0%
1 Jan 1997 Jahr
28.008
+0.039
0.14%
1 Jan 1998 Jahr
29.756
+1.748
6.24%
1 Jan 1999 Jahr
29.855
+0.099
0.33%
1 Jan 2000 Jahr
28.753
-1.102
-3.69%
1 Jan 2001 Jahr
26.42
-2.332
-8.11%
1 Jan 2002 Jahr
23.374
-3.046
-11.53%
1 Jan 2003 Jahr
27.547
+4.173
17.85%
1 Jan 2004 Jahr
26.212
-1.335
-4.85%
1 Jan 2005 Jahr
27.023
+0.811
3.1%
1 Jan 2006 Jahr
26.2
-0.823
-3.05%
1 Jan 2007 Jahr
29.581
+3.381
12.91%
1 Jan 2008 Jahr
29.337
-0.244
-0.83%
1 Jan 2009 Jahr
27.868
-1.468
-5.0%
1 Jan 2010 Jahr
31.389
+3.521
12.63%
1 Jan 2011 Jahr
34.426
+3.037
9.68%
1 Jan 2012 Jahr
31.658
-2.769
-8.04%
1 Jan 2013 Jahr
35.806
+4.149
13.1%
1 Jan 2014 Jahr
36.162
+0.356
0.99%
1 Jan 2015 Jahr
35.665
-0.497
-1.37%
Bewertung der Länder gemäß mit laufender Statistik nach Jahren

Kommentare:

Abschicken
PremiumAbout & FeedbackVereinbarungPrivatheit
logo
© 2022 Selected Technologies LLC – Morgan Hill, California