33
/de/
AIzaSyB4mHJ5NPEv-XzF7P6NDYXjlkCWaeKw5bc
November 30, 2025
161834
Italy
ITA
true
2
1
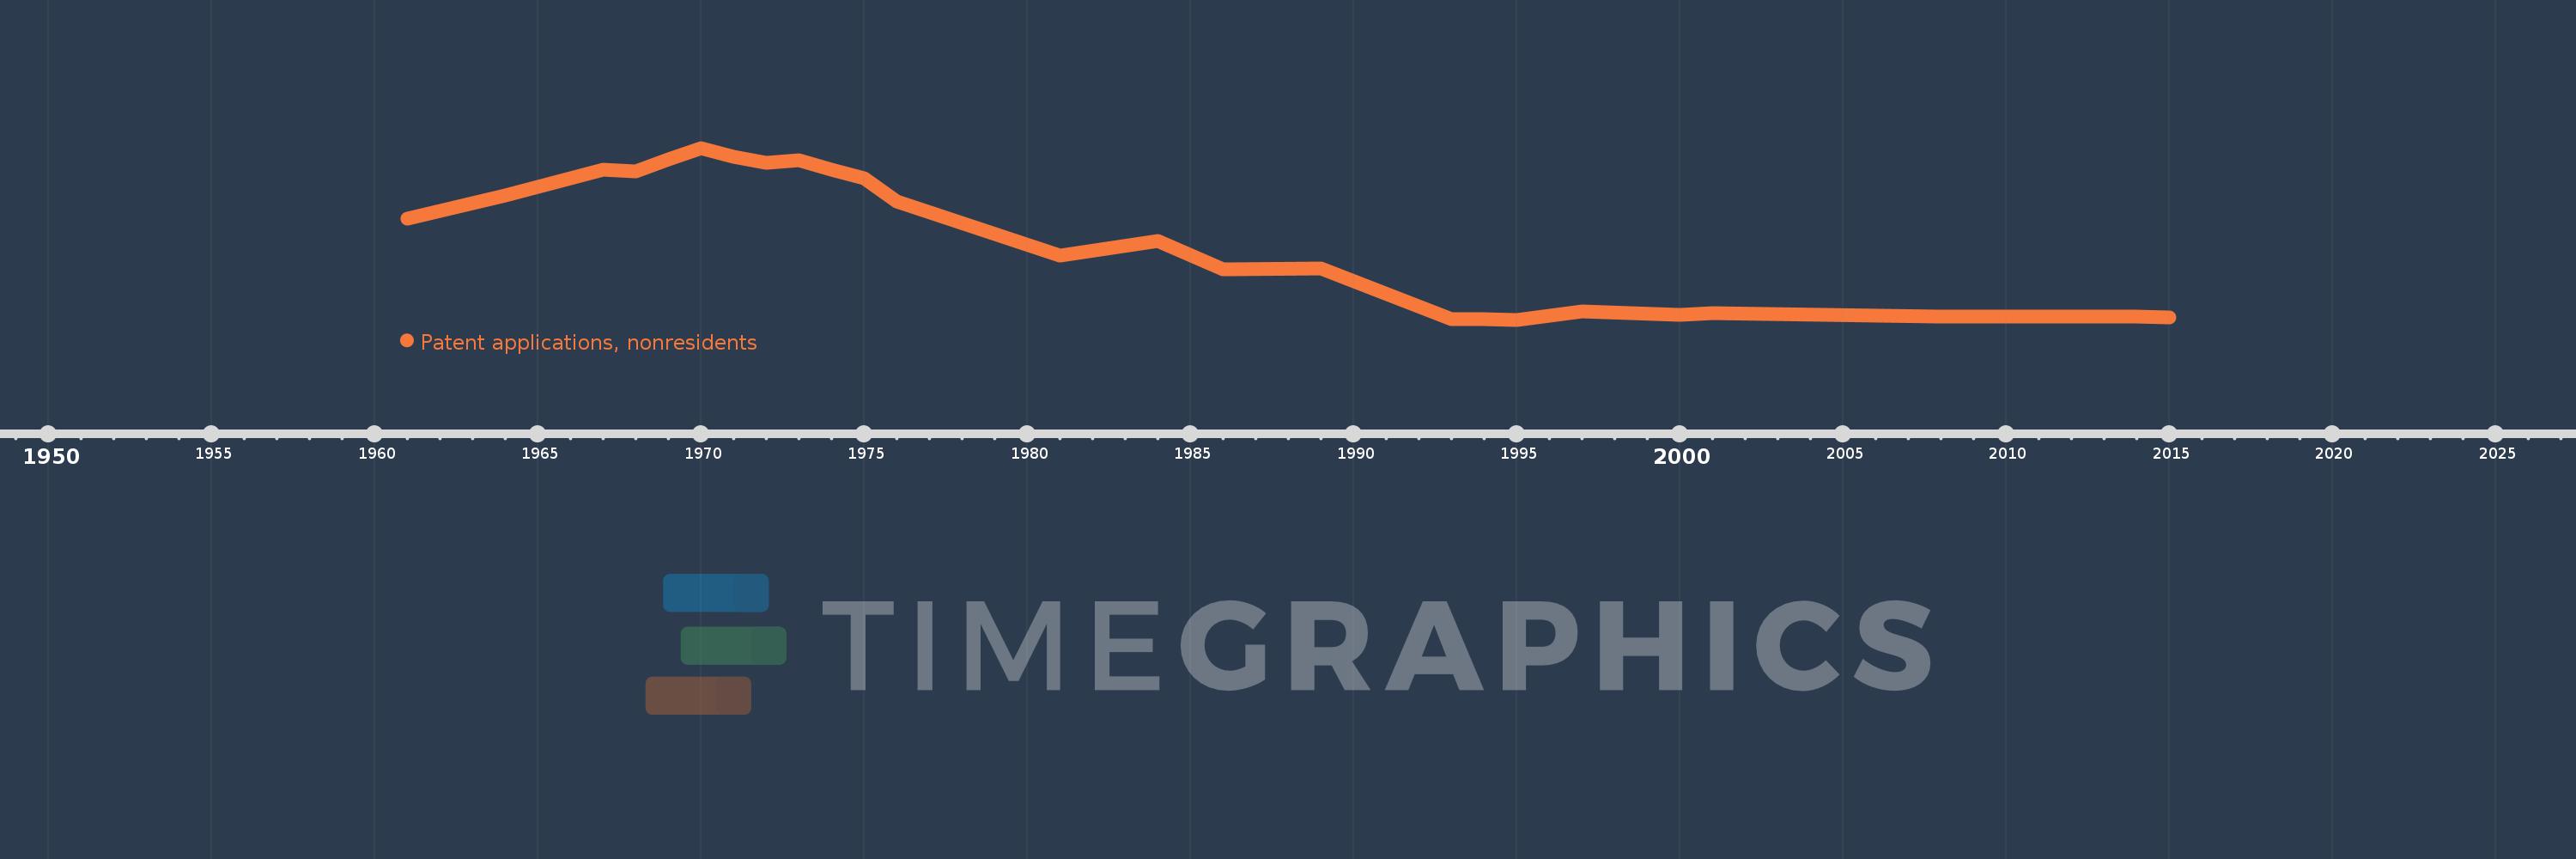
Patent applications, nonresidents
2015,2014,2013,2012,2011,2010,2009,2008,2001,2000,1997,1995,1994,1993,1989,1986,1984,1981,1976,1975,1974,1973,1972,1971,1970,1969,1968,1967,1964,1961