33
/de/
AIzaSyAYiBZKx7MnpbEhh9jyipgxe19OcubqV5w
August 1, 2025
161475
Italy
ITA
true
2
1
GDP, PPP (current international $)
2016,2015,2014,2013,2012,2011,2010,2009,2008,2007,2006,2005,2004,2003,2002,2001,2000,1999,1998,1997,1996,1995,1994,1993,1992,1991
Download
Bibliothek der Globalstatistik →Italy →

GDP, PPP (current international $)

Diese Statistik in anderen Ländern:

AfghanistanAlbaniaAlgeriaAngolaAntigua and BarbudaArab WorldArgentinaArmeniaArubaAustraliaAustriaAzerbaijanBahamas, TheBahrainBangladeshBarbadosBelarusBelgiumBelizeBeninBermudaBhutanBoliviaBosnia and HerzegovinaBotswanaBrazilBrunei DarussalamBulgariaBurkina FasoBurundiCabo VerdeCambodiaCameroonCanadaCaribbean small statesCayman IslandsCentral African RepublicCentral Europe and the BalticsChadChileChinaColombiaComorosCongo, Dem. Rep.Congo, Rep.Costa RicaCote d'IvoireCroatiaCubaCyprusCzech RepublicDenmarkDjiboutiDominicaDominican RepublicEarly-demographic dividendEast Asia & PacificEast Asia & Pacific (excluding high income)East Asia & Pacific (IDA & IBRD countries)EcuadorEgypt, Arab Rep.El SalvadorEquatorial GuineaEritreaEstoniaEthiopiaEuro areaEurope & Central AsiaEurope & Central Asia (excluding high income)Europe & Central Asia (IDA & IBRD countries)European UnionFijiFinlandFragile and conflict affected situationsFranceGabonGambia, TheGeorgiaGermanyGhanaGreeceGrenadaGuatemalaGuineaGuinea-BissauGuyanaHaitiHeavily indebted poor countries (HIPC)High incomeHondurasHong Kong SAR, ChinaHungaryIBRD onlyIcelandIDA & IBRD totalIDA blendIDA onlyIDA totalIndiaIndonesiaIran, Islamic Rep.IraqIrelandIsraelItalyJamaicaJapanJordanKazakhstanKenyaKiribatiKorea, Rep.KosovoKuwaitKyrgyz RepublicLao PDRLate-demographic dividendLatin America & Caribbean Latin America & Caribbean (excluding high income)Latin America & the Caribbean (IDA & IBRD countries)LatviaLeast developed countries: UN classificationLebanonLesothoLiberiaLibyaLithuaniaLow & middle incomeLow incomeLower middle incomeLuxembourgMacao SAR, ChinaMacedonia, FYRMadagascarMalawiMalaysiaMaldivesMaliMaltaMarshall IslandsMauritaniaMauritiusMexicoMicronesia, Fed. Sts.Middle East & North AfricaMiddle East & North Africa (excluding high income)Middle East & North Africa (IDA & IBRD countries)Middle incomeMoldovaMongoliaMontenegroMoroccoMozambiqueMyanmarNamibiaNauruNepalNetherlandsNew ZealandNicaraguaNigerNigeriaNorth AmericaNorwayOECD membersOmanOther small statesPacific island small statesPakistanPalauPanamaPapua New GuineaParaguayPeruPhilippinesPolandPortugalPost-demographic dividendPre-demographic dividendPuerto RicoQatarRomaniaRussian FederationRwandaSamoaSao Tome and PrincipeSaudi ArabiaSenegalSerbiaSeychellesSierra LeoneSingaporeSint Maarten (Dutch part)Slovak RepublicSloveniaSmall statesSolomon IslandsSouth AfricaSouth AsiaSouth Asia (IDA & IBRD)South SudanSpainSri LankaSt. Kitts and NevisSt. LuciaSt. Vincent and the GrenadinesSub-Saharan Africa Sub-Saharan Africa (excluding high income)Sub-Saharan Africa (IDA & IBRD countries)SudanSurinameSwazilandSwedenSwitzerlandTajikistanTanzaniaThailandTimor-LesteTogoTongaTrinidad and TobagoTunisiaTurkeyTurkmenistanTuvaluUgandaUkraineUnited Arab EmiratesUnited KingdomUnited StatesUpper middle incomeUruguayUzbekistanVanuatuVenezuela, RBVietnamWest Bank and GazaWorldYemen, Rep.ZambiaZimbabwe

Zeitlinie:

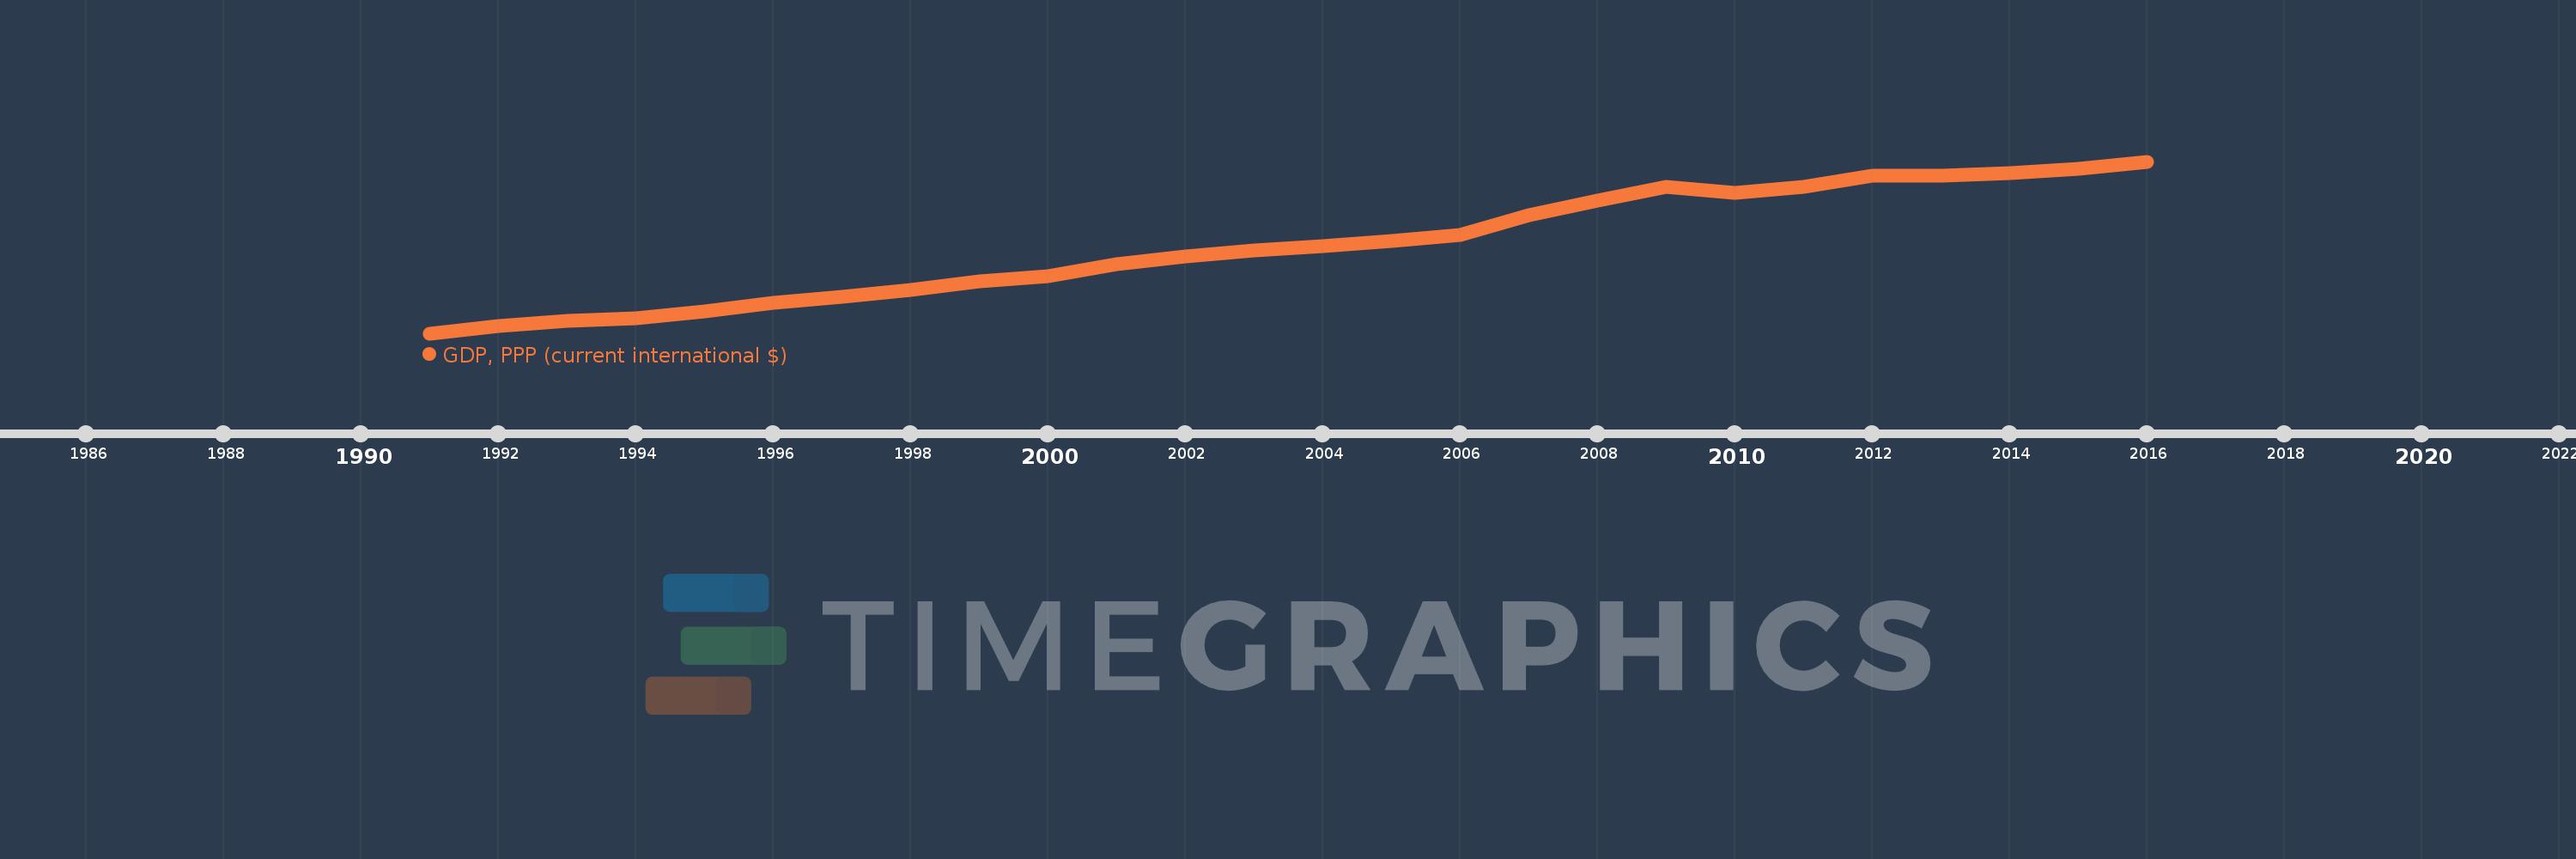
Diese Zeitleiste vorliegt die Graphik ab 1991 J. bis 2016 J. Italy. Die Angaben bis 1990 J. sind nicht vorhanden. Die Zahl aktueller Beobachtungen nach Daten: 26.

Die Quelle (Bezeichnung):

Kennzahlen der Weltentwicklung

Die Quelle (Einrichtung):

World Bank, International Comparison Program database.

Kategorien:

Economy & Growth

Es wurde aktualisiert:

23 Apr 2017 Jahr

Kennzahlen der Wertänderungen vom Jahr zum Jahr

im Durchschnitt:
1.668 Trln
Minimum:
1.052 Trln
1 Jan 1991 Jahr
Maximum:
2.26 Trln
1 Jan 2016 Jahr
Zum Datum der Beobachtung
Wert
Absolute Veränderung
Die Veränderung bezüglich dem vorherigen Wert
1 Jan 1991 Jahr
1.052 Trln
+1.052 Trln
0.0%
1 Jan 1992 Jahr
1.104 Trln
+51.735 Mlrd.
4.92%
1 Jan 1993 Jahr
1.138 Trln
+34.577 Mlrd.
3.13%
1 Jan 1994 Jahr
1.155 Trln
+17.143 Mlrd.
1.51%
1 Jan 1995 Jahr
1.205 Trln
+49.969 Mlrd.
4.32%
1 Jan 1996 Jahr
1.266 Trln
+60.663 Mlrd.
5.03%
1 Jan 1997 Jahr
1.306 Trln
+40.025 Mlrd.
3.16%
1 Jan 1998 Jahr
1.354 Trln
+48.086 Mlrd.
3.68%
1 Jan 1999 Jahr
1.418 Trln
+64.079 Mlrd.
4.73%
1 Jan 2000 Jahr
1.453 Trln
+34.962 Mlrd.
2.47%
1 Jan 2001 Jahr
1.538 Trln
+84.635 Mlrd.
5.82%
1 Jan 2002 Jahr
1.595 Trln
+57.287 Mlrd.
3.73%
1 Jan 2003 Jahr
1.634 Trln
+39.17 Mlrd.
2.46%
1 Jan 2004 Jahr
1.667 Trln
+32.383 Mlrd.
1.98%
1 Jan 2005 Jahr
1.7 Trln
+33.238 Mlrd.
1.99%
1 Jan 2006 Jahr
1.742 Trln
+42.205 Mlrd.
2.48%
1 Jan 2007 Jahr
1.881 Trln
+138.906 Mlrd.
7.97%
1 Jan 2008 Jahr
1.986 Trln
+104.927 Mlrd.
5.58%
1 Jan 2009 Jahr
2.083 Trln
+96.72 Mlrd.
4.87%
1 Jan 2010 Jahr
2.042 Trln
-40.936 Mlrd.
-1.97%
1 Jan 2011 Jahr
2.079 Trln
+37.498 Mlrd.
1.84%
1 Jan 2012 Jahr
2.158 Trln
+79.085 Mlrd.
3.8%
1 Jan 2013 Jahr
2.158 Trln
-737.968 Mln.
-0.03%
1 Jan 2014 Jahr
2.178 Trln
+20.738 Mlrd.
0.96%
1 Jan 2015 Jahr
2.206 Trln
+27.984 Mlrd.
1.28%
1 Jan 2016 Jahr
2.26 Trln
+53.964 Mlrd.
2.45%

Bewertung der Länder gemäß mit laufender Statistik nach Jahren