33
/de/
AIzaSyAYiBZKx7MnpbEhh9jyipgxe19OcubqV5w
August 1, 2025
158699
Iraq
IRQ
true
2
1
Net bilateral aid flows from DAC donors, Australia (current US$)
2015,2014,2013,2012,2011,2010,2009,2008,2007,2006,2005,2004,1998,1996,1994,1993,1992,1991,1990,1989,1979
Download
Bibliothek der Globalstatistik →Iraq →

Net bilateral aid flows from DAC donors, Australia (current US$)

Diese Statistik in anderen Ländern:

AfghanistanAlbaniaAlgeriaAngolaAntigua and BarbudaArab WorldArgentinaArmeniaAzerbaijanBahamas, TheBahrainBangladeshBarbadosBelarusBelizeBeninBhutanBoliviaBosnia and HerzegovinaBotswanaBrazilBrunei DarussalamBulgariaBurkina FasoBurundiCabo VerdeCambodiaCameroonCaribbean small statesCayman IslandsCentral African RepublicCentral Europe and the BalticsChadChileChinaColombiaComorosCongo, Dem. Rep.Congo, Rep.Costa RicaCote d'IvoireCroatiaCubaCyprusCzech RepublicDjiboutiDominicaDominican RepublicEast Asia & PacificEast Asia & Pacific (excluding high income)East Asia & Pacific (IDA & IBRD countries)EcuadorEgypt, Arab Rep.El SalvadorEquatorial GuineaEritreaEstoniaEthiopiaEuro areaEurope & Central AsiaEurope & Central Asia (excluding high income)Europe & Central Asia (IDA & IBRD countries)European UnionFijiFragile and conflict affected situationsFrench PolynesiaGabonGambia, TheGeorgiaGhanaGrenadaGuatemalaGuineaGuinea-BissauGuyanaHaitiHeavily indebted poor countries (HIPC)High incomeHondurasHong Kong SAR, ChinaHungaryIBRD onlyIDA & IBRD totalIDA blendIDA onlyIDA totalIndiaIndonesiaIran, Islamic Rep.IraqIsraelJamaicaJordanKazakhstanKenyaKiribatiKorea, Dem. People’s Rep.Korea, Rep.KuwaitKyrgyz RepublicLao PDRLatin America & Caribbean Latin America & Caribbean (excluding high income)Latin America & the Caribbean (IDA & IBRD countries)LatviaLeast developed countries: UN classificationLebanonLesothoLiberiaLibyaLithuaniaLow & middle incomeLow incomeLower middle incomeMacao SAR, ChinaMacedonia, FYRMadagascarMalawiMalaysiaMaldivesMaliMaltaMarshall IslandsMauritaniaMauritiusMexicoMicronesia, Fed. Sts.Middle East & North AfricaMiddle East & North Africa (excluding high income)Middle East & North Africa (IDA & IBRD countries)Middle incomeMoldovaMongoliaMontenegroMoroccoMozambiqueMyanmarNamibiaNauruNepalNew CaledoniaNicaraguaNigerNigeriaNorthern Mariana IslandsOECD membersOmanOther small statesPacific island small statesPakistanPalauPanamaPapua New GuineaParaguayPeruPhilippinesPolandRomaniaRussian FederationRwandaSamoaSao Tome and PrincipeSaudi ArabiaSenegalSerbiaSeychellesSierra LeoneSingaporeSlovak RepublicSloveniaSmall statesSolomon IslandsSomaliaSouth AfricaSouth AsiaSouth Asia (IDA & IBRD)South SudanSri LankaSt. Kitts and NevisSt. LuciaSt. Vincent and the GrenadinesSub-Saharan Africa Sub-Saharan Africa (excluding high income)Sub-Saharan Africa (IDA & IBRD countries)SudanSurinameSwazilandSyrian Arab RepublicTajikistanTanzaniaThailandTimor-LesteTogoTongaTrinidad and TobagoTunisiaTurkeyTurkmenistanTurks and Caicos IslandsTuvaluUgandaUkraineUpper middle incomeUruguayUzbekistanVanuatuVenezuela, RBVietnamWest Bank and GazaWorldYemen, Rep.ZambiaZimbabwe

Zeitlinie:

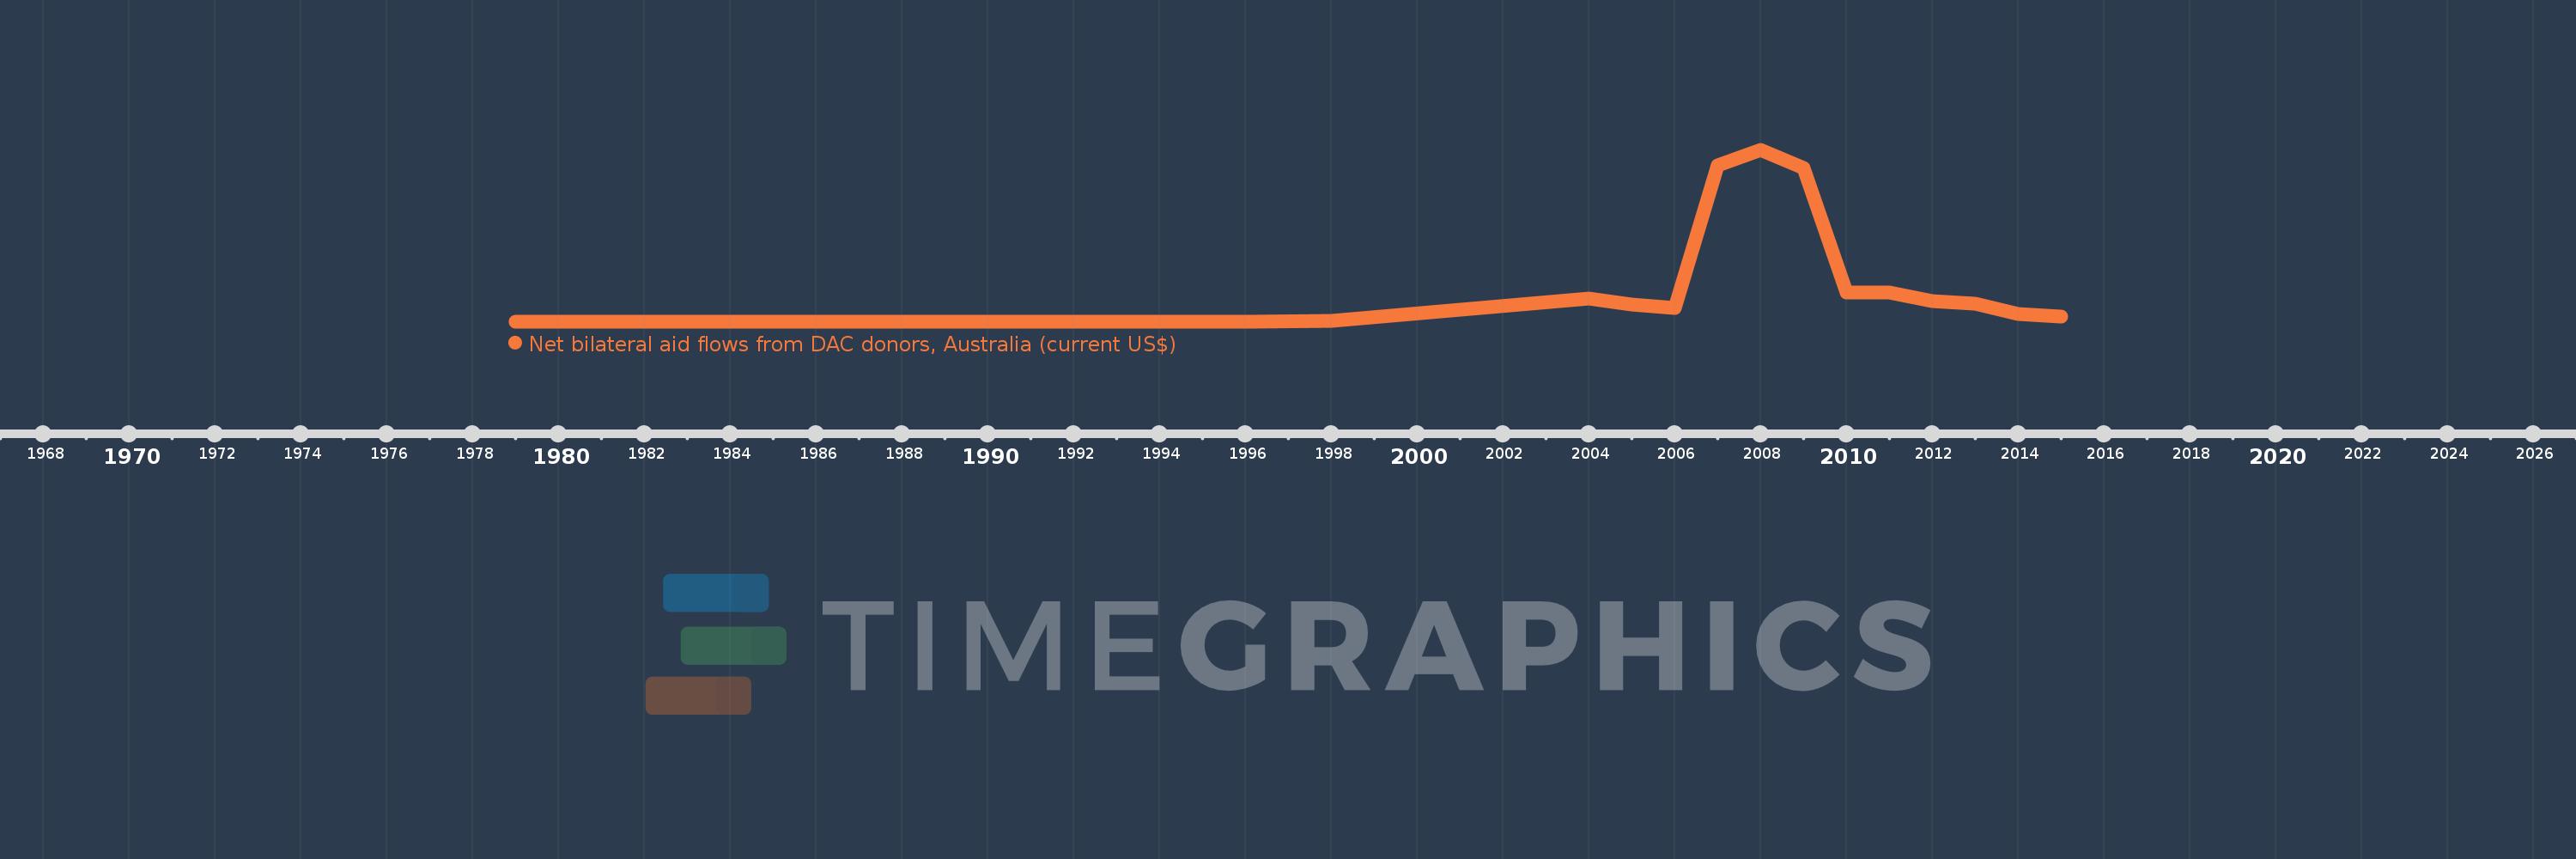
Diese Zeitleiste vorliegt die Graphik ab 1979 J. bis 2015 J. Iraq. Die Angaben bis 1978 J. sind nicht vorhanden. Die Zahl aktueller Beobachtungen nach Daten: 21.

Die Quelle (Bezeichnung):

Kennzahlen der Weltentwicklung

Die Quelle (Einrichtung):

Development Assistance Committee of the Organisation for Economic Co-operation and Development, Geographical Distribution of Financial Flows to Developing Countries, Development Co-operation Report, and International Development Statistics database. Data are available online at: www.oecd.org/dac/stats/idsonline.

Kategorien:

Aid Effectiveness

Es wurde aktualisiert:

23 Apr 2017 Jahr

Kennzahlen der Wertänderungen vom Jahr zum Jahr

im Durchschnitt:
54.326 Mln.
Minimum:
10.0 Tsnd.
1 Jan 1979 Jahr
Maximum:
300.62 Mln.
1 Jan 2008 Jahr
Zum Datum der Beobachtung
Wert
Absolute Veränderung
Die Veränderung bezüglich dem vorherigen Wert
1 Jan 1979 Jahr
10.0 Tsnd.
+10.0 Tsnd.
0.0%
1 Jan 1989 Jahr
130.0 Tsnd.
+120.0 Tsnd.
1.2 Tsnd.%
1 Jan 1990 Jahr
80.0 Tsnd.
-50.0 Tsnd.
-38.46%
1 Jan 1991 Jahr
60.0 Tsnd.
-20.0 Tsnd.
-25.0%
1 Jan 1992 Jahr
40.0 Tsnd.
-20.0 Tsnd.
-33.33%
1 Jan 1993 Jahr
240.0 Tsnd.
+200.0 Tsnd.
500.0%
1 Jan 1994 Jahr
480.0 Tsnd.
+240.0 Tsnd.
100.0%
1 Jan 1996 Jahr
220.0 Tsnd.
-260.0 Tsnd.
-54.17%
1 Jan 1998 Jahr
1.43 Mln.
+1.21 Mln.
550.0%
1 Jan 2004 Jahr
41.12 Mln.
+39.69 Mln.
2.78 Tsnd.%
1 Jan 2005 Jahr
30.73 Mln.
-10.39 Mln.
-25.27%
1 Jan 2006 Jahr
24.56 Mln.
-6.17 Mln.
-20.08%
1 Jan 2007 Jahr
274.61 Mln.
+250.05 Mln.
1.02 Tsnd.%
1 Jan 2008 Jahr
300.62 Mln.
+26.01 Mln.
9.47%
1 Jan 2009 Jahr
269.93 Mln.
-30.69 Mln.
-10.21%
1 Jan 2010 Jahr
52.18 Mln.
-217.75 Mln.
-80.67%
1 Jan 2011 Jahr
52.22 Mln.
+40.0 Tsnd.
0.08%
1 Jan 2012 Jahr
37.18 Mln.
-15.04 Mln.
-28.8%
1 Jan 2013 Jahr
31.67 Mln.
-5.51 Mln.
-14.82%
1 Jan 2014 Jahr
13.58 Mln.
-18.09 Mln.
-57.12%
1 Jan 2015 Jahr
9.75 Mln.
-3.83 Mln.
-28.2%

Bewertung der Länder gemäß mit laufender Statistik nach Jahren