33
/de/
AIzaSyB4mHJ5NPEv-XzF7P6NDYXjlkCWaeKw5bc
November 30, 2025
158144
Iraq
IRQ
true
2
1
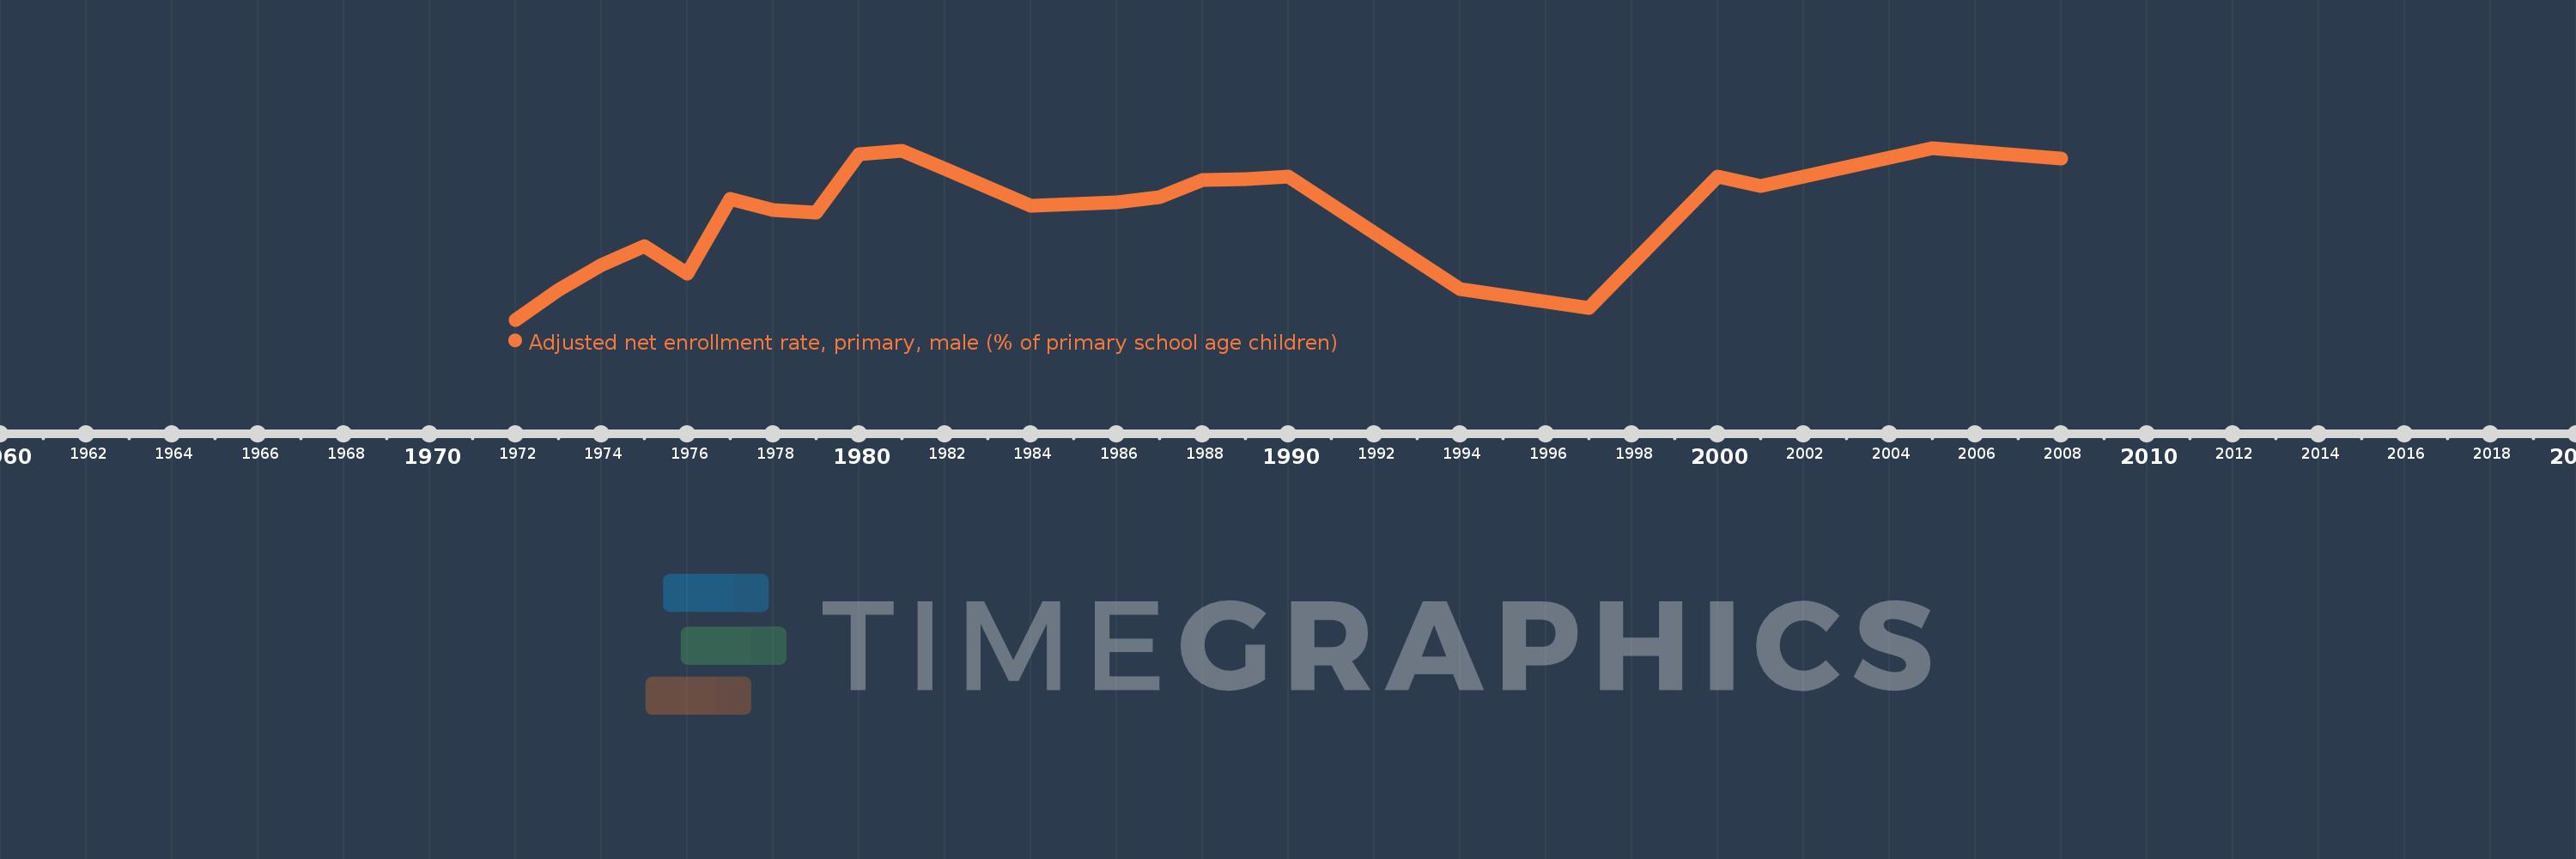
Adjusted net enrollment rate, primary, male (% of primary school age children)
2008,2005,2001,2000,1997,1994,1990,1989,1988,1987,1986,1984,1982,1981,1980,1979,1978,1977,1976,1975,1974,1973,1972