29
/de/
de
AIzaSyAYiBZKx7MnpbEhh9jyipgxe19OcubqV5w
April 1, 2024
154969
India
IND
true
2
1
Net bilateral aid flows from DAC donors, Slovenia (current US$)
2014,2013,2010,2009
Download
Bibliothek der Globalstatistik →India →

Net bilateral aid flows from DAC donors, Slovenia (current US$)

Diese Statistik in anderen Ländern:
AfghanistanAlbaniaAlgeriaArab WorldArgentinaBelarusBosnia and HerzegovinaBrazilBurkina FasoBurundiCabo VerdeCameroonCaribbean small statesCentral African RepublicCentral Europe and the BalticsChadChinaColombiaCongo, Dem. Rep.Congo, Rep.Costa RicaCroatiaCubaDominicaEast Asia & PacificEast Asia & Pacific (excluding high income)East Asia & Pacific (IDA & IBRD countries)Egypt, Arab Rep.EritreaEthiopiaEurope & Central AsiaEurope & Central Asia (excluding high income)Europe & Central Asia (IDA & IBRD countries)European UnionFragile and conflict affected situationsGeorgiaGhanaGuineaGuyanaHaitiHeavily indebted poor countries (HIPC)High incomeIBRD onlyIDA & IBRD totalIDA blendIDA onlyIDA totalIndiaIran, Islamic Rep.IraqJamaicaJordanKenyaKosovoKyrgyz RepublicLatin America & Caribbean Latin America & Caribbean (excluding high income)Latin America & the Caribbean (IDA & IBRD countries)Least developed countries: UN classificationLiberiaLibyaLow & middle incomeLow incomeLower middle incomeMacedonia, FYRMadagascarMalawiMalaysiaMaliMarshall IslandsMexicoMicronesia, Fed. Sts.Middle East & North AfricaMiddle East & North Africa (excluding high income)Middle East & North Africa (IDA & IBRD countries)Middle incomeMoldovaMontenegroMyanmarNepalNigerNigeriaOECD membersOther small statesPacific island small statesPakistanPalauPhilippinesRwandaSenegalSerbiaSeychellesSierra LeoneSmall statesSomaliaSouth AfricaSouth AsiaSouth Asia (IDA & IBRD)South SudanSri LankaSt. LuciaSt. Vincent and the GrenadinesSub-Saharan Africa Sub-Saharan Africa (excluding high income)Sub-Saharan Africa (IDA & IBRD countries)SudanSyrian Arab RepublicTajikistanTunisiaTurkeyUgandaUkraineUpper middle incomeUzbekistanVenezuela, RBWest Bank and GazaWorldZimbabwe
Zeitlinie:
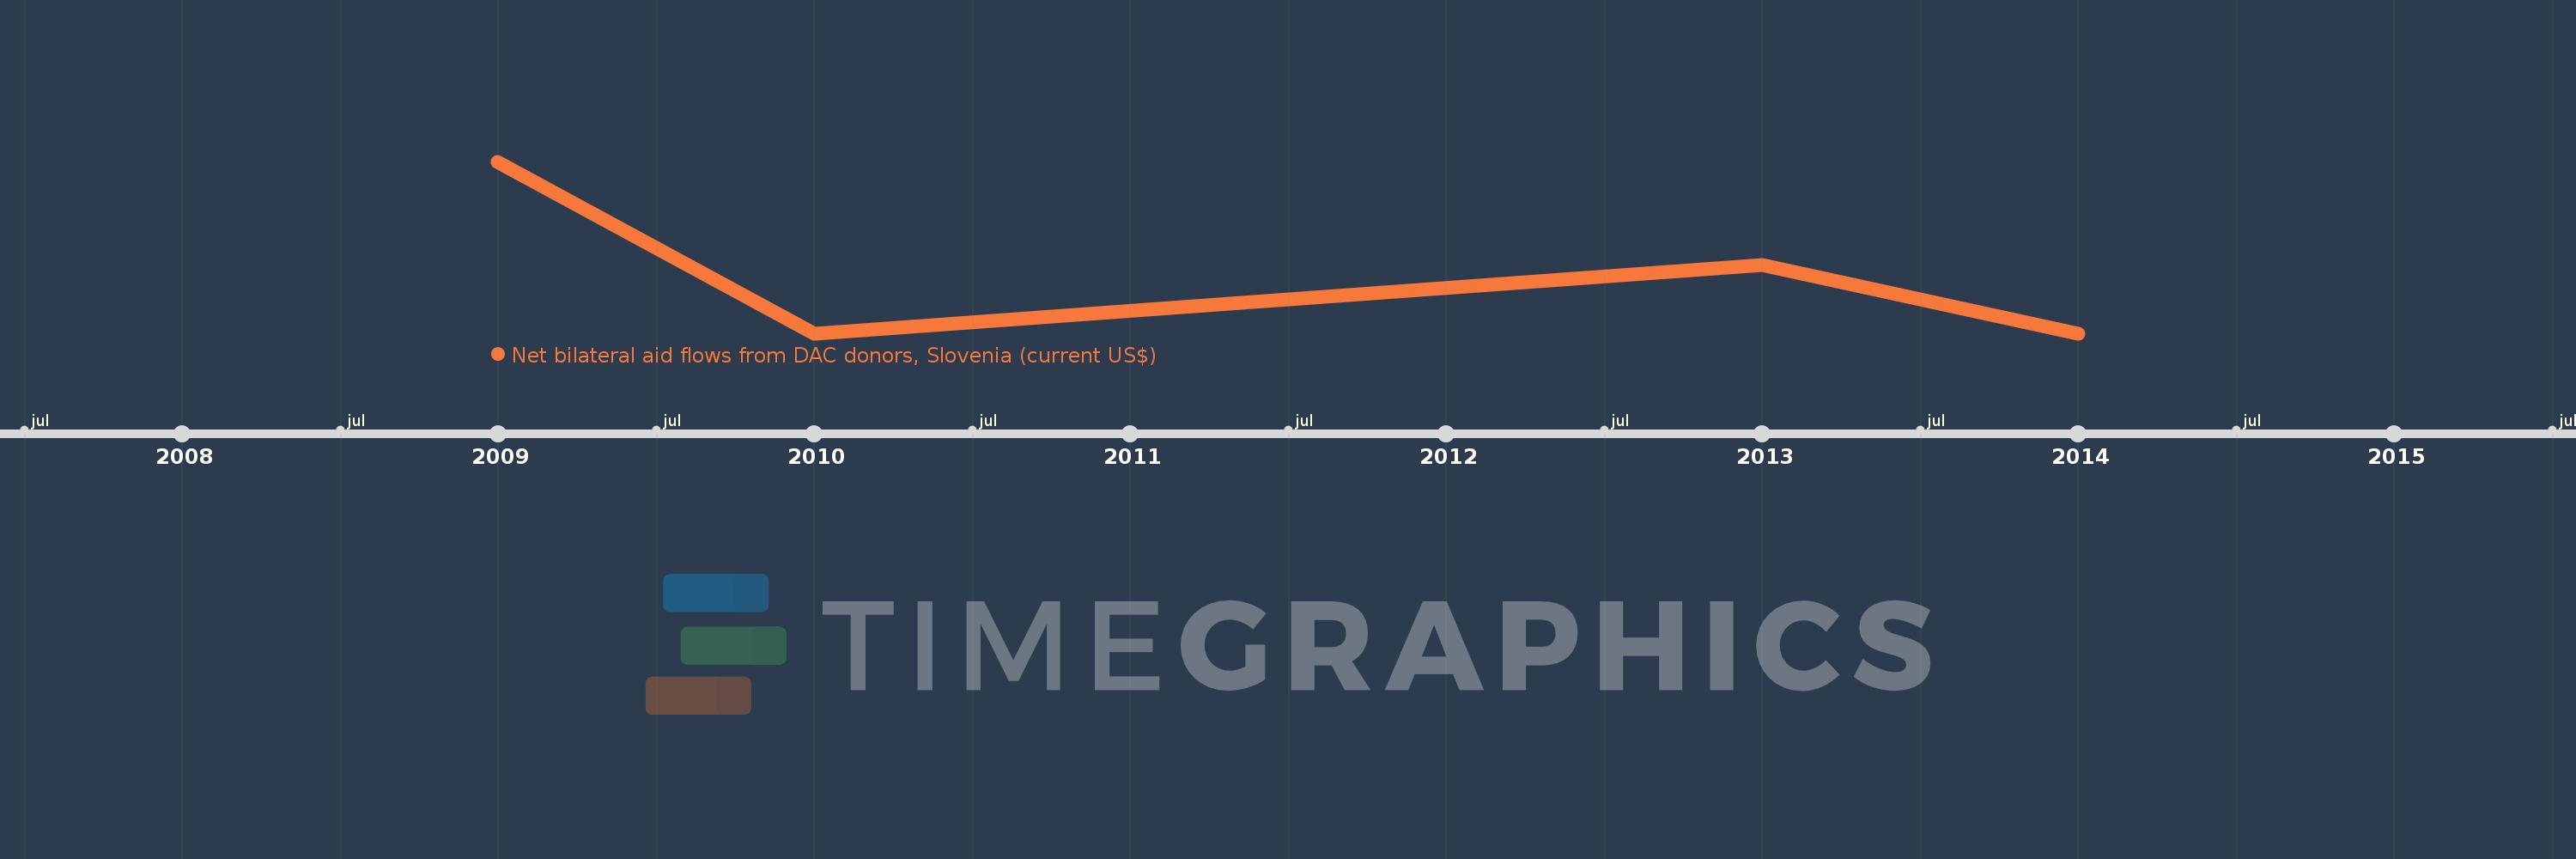
Diese Zeitleiste vorliegt die Graphik ab 2009 J. bis 2014 J. India. Die Angaben bis 2008 J. sind nicht vorhanden. Die Zahl aktueller Beobachtungen nach Daten: 4.
Die Quelle (Bezeichnung):
Kennzahlen der Weltentwicklung
Die Quelle (Einrichtung):
Development Assistance Committee of the Organisation for Economic Co-operation and Development, Geographical Distribution of Financial Flows to Developing Countries, Development Co-operation Report, and International Development Statistics database. Data are available online at: www.oecd.org/dac/stats/idsonline.
Kategorien:
Aid Effectiveness
Es wurde aktualisiert:
23 Apr 2017 Jahr
Kennzahlen der Wertänderungen vom Jahr zum Jahr
im Durchschnitt:
27.5 Tsnd.
Minimum:
10.0 Tsnd.
1 Jan 2010 Jahr
Maximum:
60.0 Tsnd.
1 Jan 2009 Jahr
Zum Datum der Beobachtung
Wert
Absolute Veränderung
Die Veränderung bezüglich dem vorherigen Wert
1 Jan 2009 Jahr
60.0 Tsnd.
+60.0 Tsnd.
0.0%
1 Jan 2010 Jahr
10.0 Tsnd.
-50.0 Tsnd.
-83.33%
1 Jan 2013 Jahr
30.0 Tsnd.
+20.0 Tsnd.
200.0%
1 Jan 2014 Jahr
10.0 Tsnd.
-20.0 Tsnd.
-66.67%
Bewertung der Länder gemäß mit laufender Statistik nach Jahren

Kommentare:

Abschicken
PremiumAbout & FeedbackVereinbarungPrivatheit
logo
© 2022 Selected Technologies LLC – Morgan Hill, California