33
/de/
AIzaSyAYiBZKx7MnpbEhh9jyipgxe19OcubqV5w
August 1, 2025
154276
India
IND
true
2
1
Bound rate, simple mean, all products (%)
2014,2013,2012,2011,2010,2009,2008,2007,2006,2005,2004,2003,2002,2001,2000,1998
Download
Bibliothek der Globalstatistik →India →

Bound rate, simple mean, all products (%)

Diese Statistik in anderen Ländern:

AlbaniaAngolaAntigua and BarbudaArgentinaArmeniaAustraliaAustriaBahrainBangladeshBarbadosBelgiumBelizeBeninBoliviaBotswanaBrazilBrunei DarussalamBulgariaBurkina FasoBurundiCabo VerdeCambodiaCameroonCanadaCentral African RepublicChadChileChinaColombiaCongo, Dem. Rep.Congo, Rep.Costa RicaCote d'IvoireCubaCyprusCzech RepublicDenmarkDjiboutiDominicaDominican RepublicEast Asia & Pacific (excluding high income)EcuadorEgypt, Arab Rep.El SalvadorEstoniaEurope & Central Asia (excluding high income)European UnionFijiFinlandFranceGabonGambia, TheGeorgiaGermanyGhanaGreeceGrenadaGuatemalaGuineaGuinea-BissauGuyanaHaitiHigh incomeHondurasHong Kong SAR, ChinaHungaryIcelandIndiaIndonesiaIrelandIsraelItalyJamaicaJapanJordanKenyaKorea, Rep.KuwaitKyrgyz RepublicLatin America & Caribbean (excluding high income)LatviaLesothoLithuaniaLow & middle incomeLow incomeLower middle incomeLuxembourgMacao SAR, ChinaMacedonia, FYRMadagascarMalawiMalaysiaMaldivesMaliMaltaMauritaniaMauritiusMexicoMiddle East & North Africa (excluding high income)Middle incomeMoldovaMongoliaMoroccoMozambiqueMyanmarNamibiaNepalNetherlandsNew ZealandNicaraguaNigerNigeriaNorwayOECD membersOmanPakistanPanamaPapua New GuineaParaguayPeruPhilippinesPolandPortugalQatarRomaniaRwandaSaudi ArabiaSenegalSierra LeoneSingaporeSlovak RepublicSloveniaSolomon IslandsSouth AfricaSouth AsiaSpainSri LankaSt. Kitts and NevisSt. LuciaSt. Vincent and the GrenadinesSub-Saharan Africa (excluding high income)SurinameSwazilandSwedenSwitzerlandTanzaniaThailandTogoTongaTrinidad and TobagoTunisiaTurkeyUgandaUkraineUnited Arab EmiratesUnited KingdomUnited StatesUpper middle incomeUruguayVenezuela, RBVietnamWorldZambiaZimbabwe

Zeitlinie:

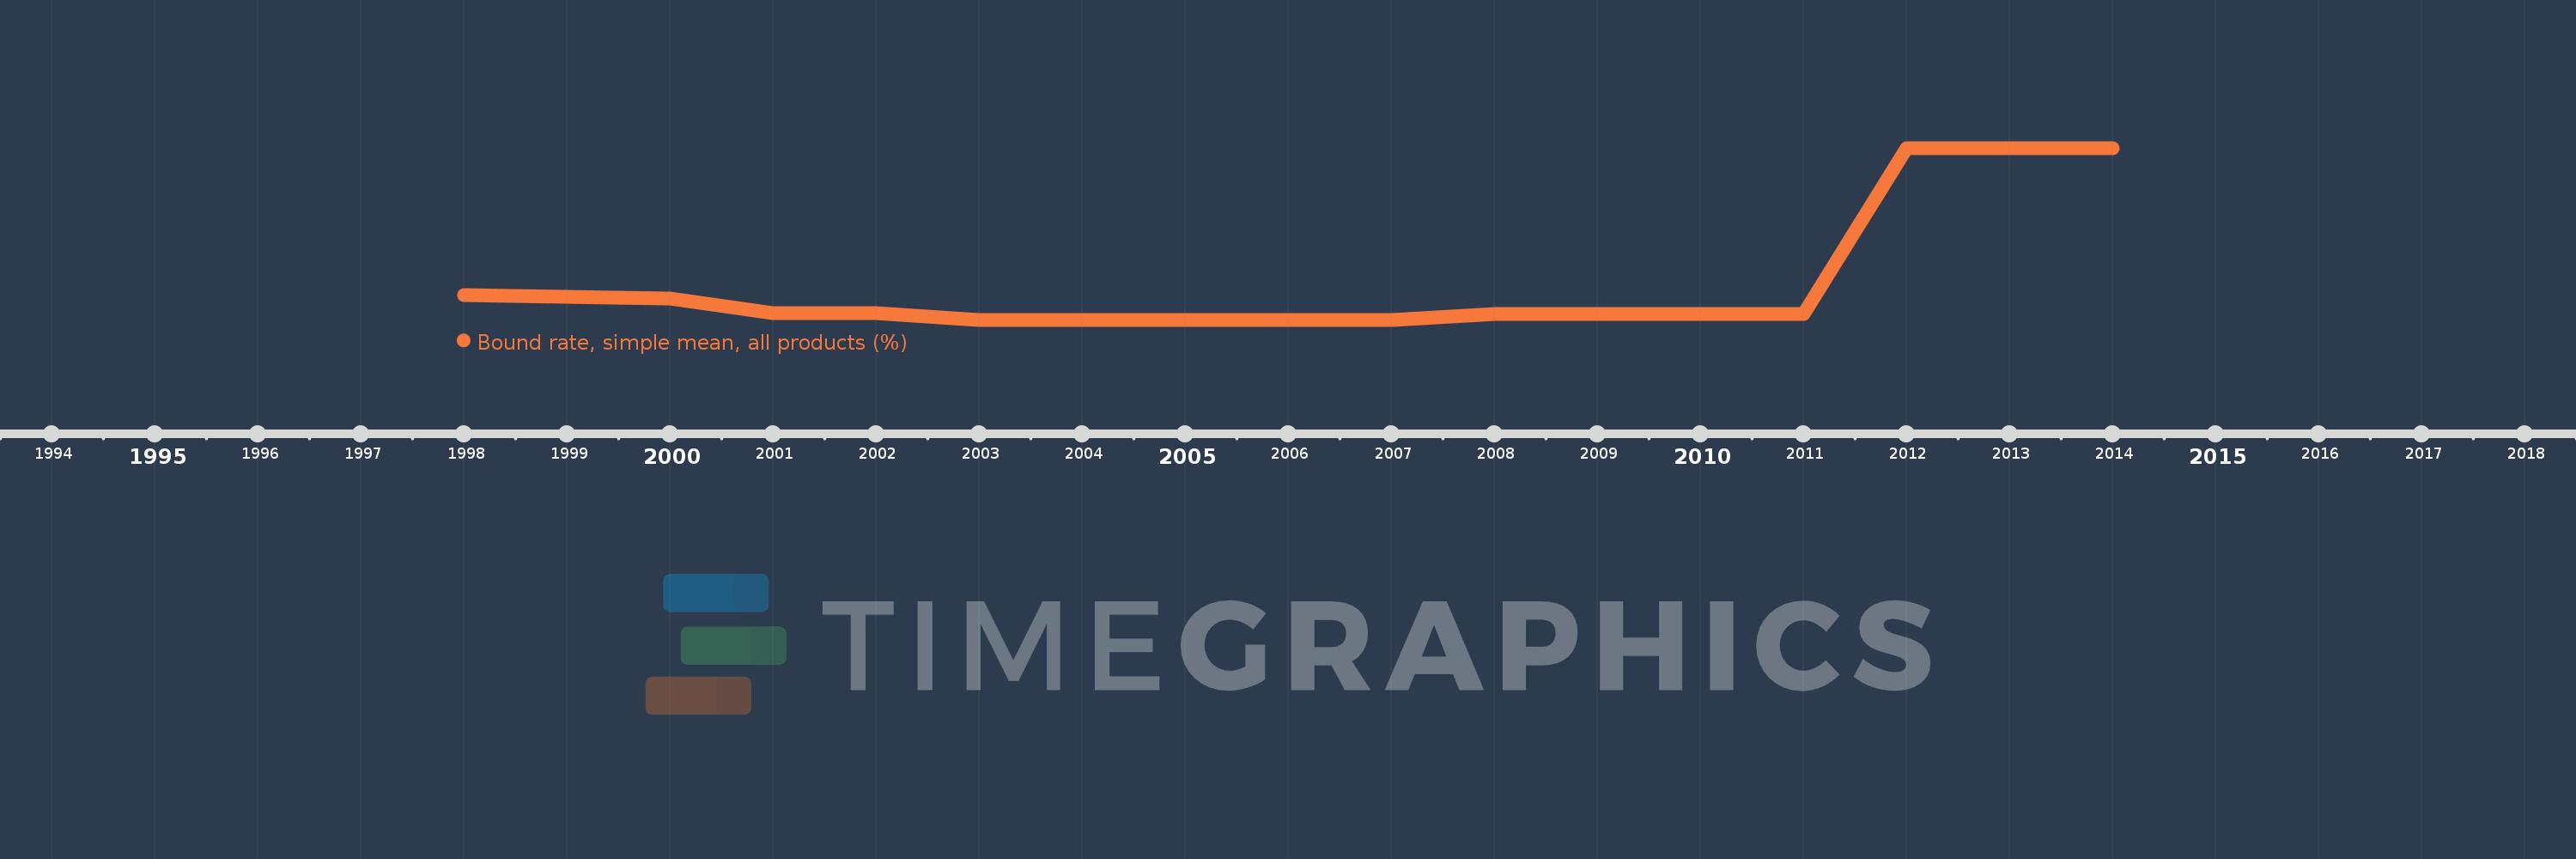
Diese Zeitleiste vorliegt die Graphik ab 1998 J. bis 2014 J. India. Die Angaben bis 1997 J. sind nicht vorhanden. Die Zahl aktueller Beobachtungen nach Daten: 16.

Die Quelle (Bezeichnung):

Kennzahlen der Weltentwicklung

Die Quelle (Einrichtung):

World Bank staff estimates using the World Integrated Trade Solution system, based on data from World Trade Organization.

Kategorien:

Private Sector, Trade

Es wurde aktualisiert:

23 Apr 2017 Jahr

Kennzahlen der Wertänderungen vom Jahr zum Jahr

im Durchschnitt:
50.078
Minimum:
49.52
1 Jan 2003 Jahr
Maximum:
52.09
1 Jan 2012 Jahr
Zum Datum der Beobachtung
Wert
Absolute Veränderung
Die Veränderung bezüglich dem vorherigen Wert
1 Jan 1998 Jahr
49.89
+49.89
0.0%
1 Jan 2000 Jahr
49.84
-0.05
-0.1%
1 Jan 2001 Jahr
49.62
-0.22
-0.44%
1 Jan 2002 Jahr
49.62
0.0
0.0%
1 Jan 2003 Jahr
49.52
-0.1
-0.2%
1 Jan 2004 Jahr
49.52
0.0
0.0%
1 Jan 2005 Jahr
49.52
0.0
0.0%
1 Jan 2006 Jahr
49.52
0.0
0.0%
1 Jan 2007 Jahr
49.52
0.0
0.0%
1 Jan 2008 Jahr
49.6
+0.08
0.16%
1 Jan 2009 Jahr
49.6
0.0
0.0%
1 Jan 2010 Jahr
49.6
0.0
0.0%
1 Jan 2011 Jahr
49.6
0.0
0.0%
1 Jan 2012 Jahr
52.09
+2.49
5.02%
1 Jan 2013 Jahr
52.09
0.0
0.0%
1 Jan 2014 Jahr
52.09
0.0
0.0%

Bewertung der Länder gemäß mit laufender Statistik nach Jahren