33
/de/
AIzaSyAYiBZKx7MnpbEhh9jyipgxe19OcubqV5w
August 1, 2025
153595
Iceland
ISL
true
2
1
Gross enrolment ratio, pre-primary, male (%)
2013,2012,2011,2010,2009,2008,2007,2006,2005,2004,2003,2002,2001,2000,1999,1990,1989,1988,1987,1985,1984
Download
Bibliothek der Globalstatistik →Iceland →

Gross enrolment ratio, pre-primary, male (%)

Diese Statistik in anderen Ländern:

AfghanistanAlbaniaAlgeriaAndorraAngolaAntigua and BarbudaArab WorldArgentinaArmeniaArubaAustraliaAustriaAzerbaijanBahamas, TheBahrainBangladeshBarbadosBelarusBelgiumBelizeBeninBermudaBhutanBoliviaBosnia and HerzegovinaBotswanaBrazilBrunei DarussalamBulgariaBurkina FasoBurundiCabo VerdeCambodiaCameroonCanadaCaribbean small statesCentral African RepublicCentral Europe and the BalticsChadChileChinaColombiaComorosCongo, Dem. Rep.Congo, Rep.Costa RicaCote d'IvoireCroatiaCubaCyprusCzech RepublicDenmarkDjiboutiDominicaDominican RepublicEarly-demographic dividendEast Asia & PacificEast Asia & Pacific (excluding high income)East Asia & Pacific (IDA & IBRD countries)EcuadorEgypt, Arab Rep.El SalvadorEquatorial GuineaEritreaEstoniaEthiopiaEuro areaEurope & Central AsiaEurope & Central Asia (excluding high income)Europe & Central Asia (IDA & IBRD countries)European UnionFijiFinlandFragile and conflict affected situationsFranceGabonGambia, TheGeorgiaGermanyGhanaGreeceGrenadaGuatemalaGuineaGuinea-BissauGuyanaHeavily indebted poor countries (HIPC)High incomeHondurasHong Kong SAR, ChinaHungaryIBRD onlyIcelandIDA & IBRD totalIDA blendIDA onlyIDA totalIndiaIndonesiaIran, Islamic Rep.IraqIrelandIsraelItalyJamaicaJapanJordanKazakhstanKenyaKorea, Dem. People’s Rep.Korea, Rep.KuwaitKyrgyz RepublicLao PDRLate-demographic dividendLatin America & Caribbean Latin America & Caribbean (excluding high income)Latin America & the Caribbean (IDA & IBRD countries)LatviaLeast developed countries: UN classificationLebanonLesothoLiberiaLibyaLiechtensteinLithuaniaLow & middle incomeLow incomeLower middle incomeLuxembourgMacao SAR, ChinaMacedonia, FYRMadagascarMaldivesMaliMaltaMarshall IslandsMauritaniaMauritiusMexicoMicronesia, Fed. Sts.Middle East & North AfricaMiddle East & North Africa (excluding high income)Middle East & North Africa (IDA & IBRD countries)Middle incomeMoldovaMongoliaMontenegroMoroccoMozambiqueMyanmarNamibiaNauruNepalNetherlandsNew ZealandNicaraguaNigerNigeriaNorth AmericaNorwayOECD membersOmanOther small statesPacific island small statesPakistanPalauPanamaPapua New GuineaParaguayPeruPhilippinesPolandPortugalPost-demographic dividendPre-demographic dividendPuerto RicoQatarRomaniaRussian FederationRwandaSamoaSan MarinoSao Tome and PrincipeSaudi ArabiaSenegalSerbiaSeychellesSierra LeoneSlovak RepublicSloveniaSmall statesSolomon IslandsSomaliaSouth AfricaSouth AsiaSouth Asia (IDA & IBRD)South SudanSpainSri LankaSt. Kitts and NevisSt. LuciaSt. Vincent and the GrenadinesSub-Saharan Africa Sub-Saharan Africa (excluding high income)Sub-Saharan Africa (IDA & IBRD countries)SudanSurinameSwazilandSwedenSwitzerlandSyrian Arab RepublicTajikistanTanzaniaThailandTimor-LesteTogoTongaTrinidad and TobagoTunisiaTurkeyTurkmenistanTuvaluUgandaUkraineUnited Arab EmiratesUnited KingdomUnited StatesUpper middle incomeUruguayUzbekistanVanuatuVenezuela, RBVietnamWest Bank and GazaWorldYemen, Rep.Zimbabwe

Zeitlinie:

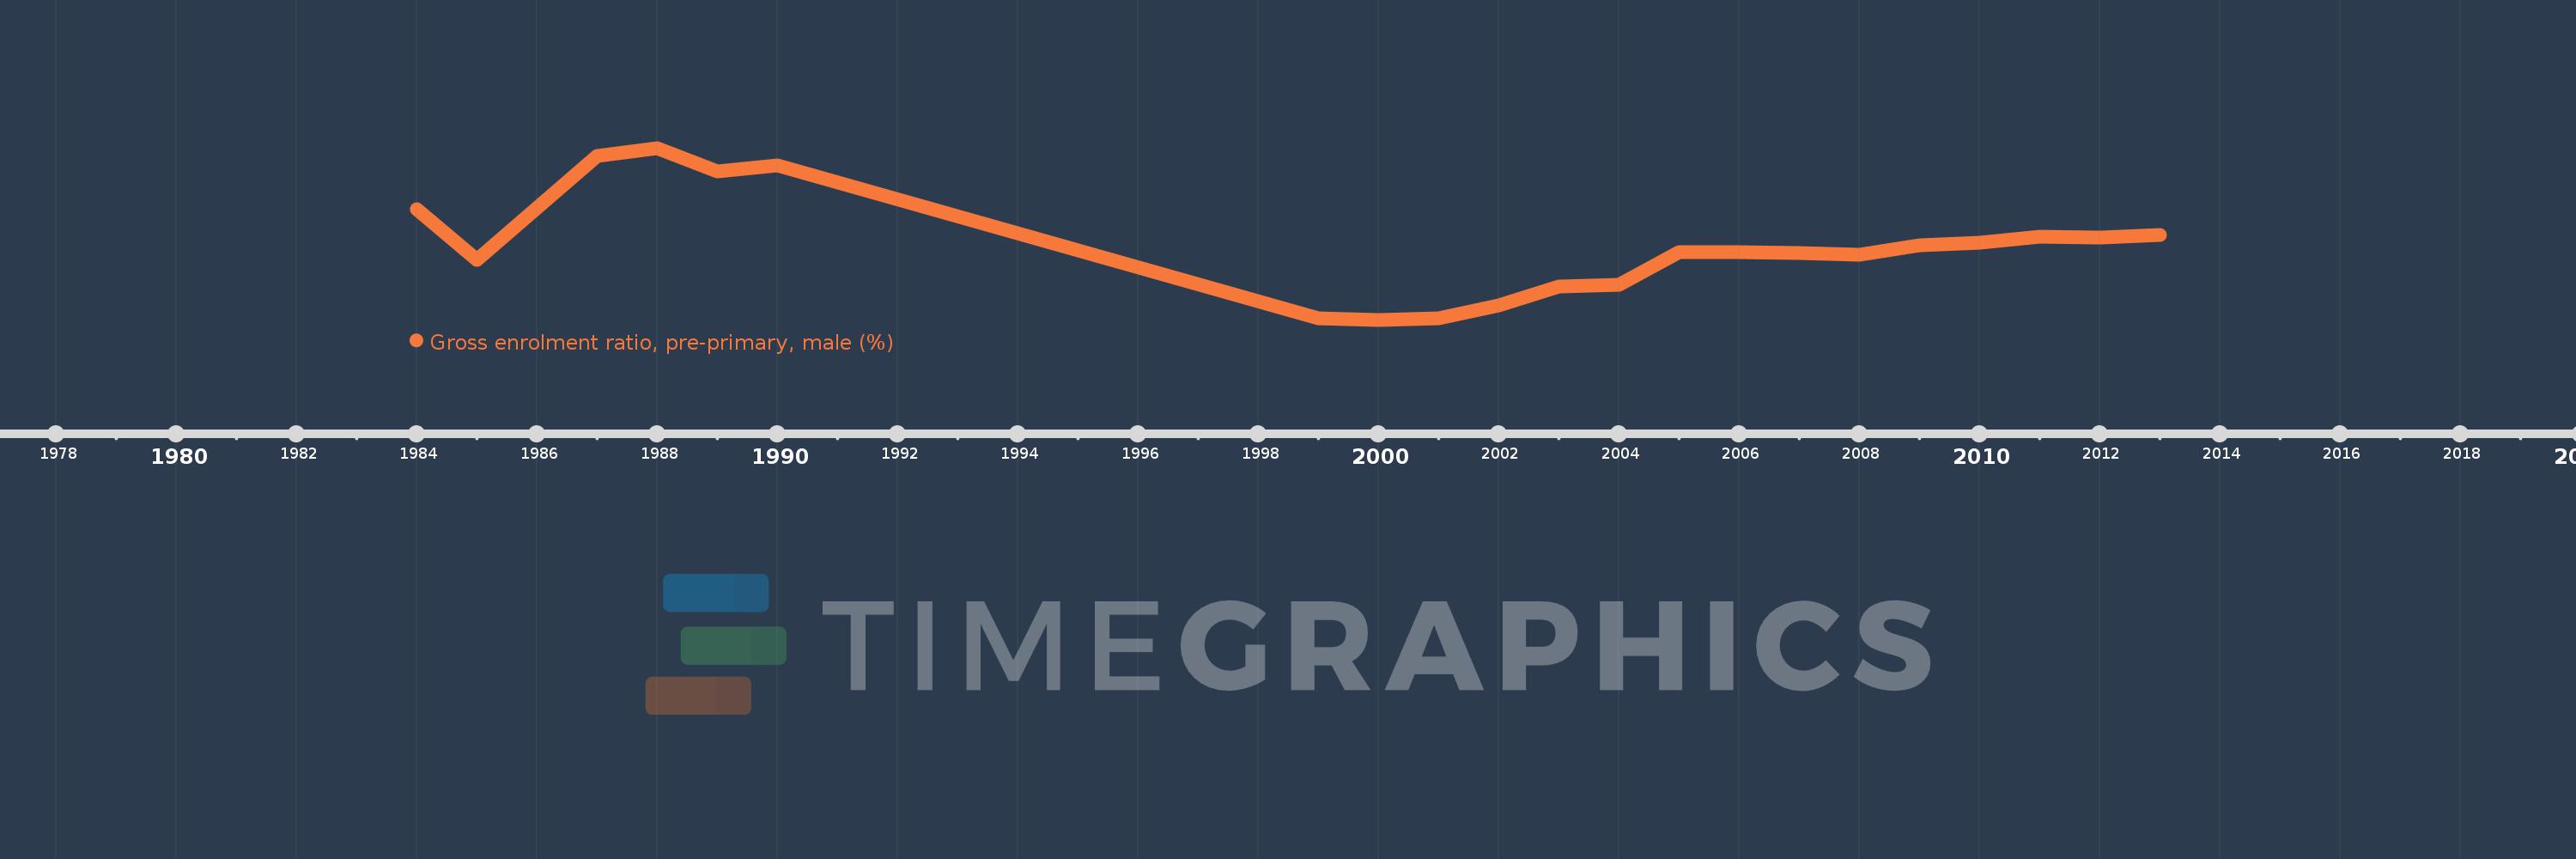
Diese Zeitleiste vorliegt die Graphik ab 1984 J. bis 2013 J. Iceland. Die Angaben bis 1983 J. sind nicht vorhanden. Die Zahl aktueller Beobachtungen nach Daten: 21.

Die Quelle (Bezeichnung):

Kennzahlen der Weltentwicklung

Die Quelle (Einrichtung):

UNESCO Institute for Statistics

Kategorien:

Education, Gender

Es wurde aktualisiert:

23 Apr 2017 Jahr

Kennzahlen der Wertänderungen vom Jahr zum Jahr

im Durchschnitt:
96.938
Minimum:
87.146
1 Jan 2000 Jahr
Maximum:
109.737
1 Jan 1988 Jahr
Zum Datum der Beobachtung
Wert
Absolute Veränderung
Die Veränderung bezüglich dem vorherigen Wert
1 Jan 1984 Jahr
101.671
+101.671
0.0%
1 Jan 1985 Jahr
95.002
-6.669
-6.56%
1 Jan 1987 Jahr
108.722
+13.72
14.44%
1 Jan 1988 Jahr
109.737
+1.014
0.93%
1 Jan 1989 Jahr
106.695
-3.042
-2.77%
1 Jan 1990 Jahr
107.488
+0.794
0.74%
1 Jan 1999 Jahr
87.371
-20.118
-18.72%
1 Jan 2000 Jahr
87.146
-0.224
-0.26%
1 Jan 2001 Jahr
87.294
+0.148
0.17%
1 Jan 2002 Jahr
89.063
+1.769
2.03%
1 Jan 2003 Jahr
91.547
+2.484
2.79%
1 Jan 2004 Jahr
91.734
+0.187
0.2%
1 Jan 2005 Jahr
96.027
+4.293
4.68%
1 Jan 2006 Jahr
96.08
+0.053
0.06%
1 Jan 2007 Jahr
95.929
-0.151
-0.16%
1 Jan 2008 Jahr
95.648
-0.281
-0.29%
1 Jan 2009 Jahr
96.969
+1.321
1.38%
1 Jan 2010 Jahr
97.229
+0.261
0.27%
1 Jan 2011 Jahr
98.075
+0.845
0.87%
1 Jan 2012 Jahr
97.988
-0.087
-0.09%
1 Jan 2013 Jahr
98.29
+0.303
0.31%

Bewertung der Länder gemäß mit laufender Statistik nach Jahren