29
/de/
de
AIzaSyAYiBZKx7MnpbEhh9jyipgxe19OcubqV5w
April 1, 2024
146113
Guinea
GIN
true
2
1
Persistence to grade 5, male (% of cohort)
2014,2013,2012,2010,2009,2008,2007,2006,2005,2004,1995,1994,1993,1992,1991,1986,1985
Download
Bibliothek der Globalstatistik →Guinea →

Persistence to grade 5, male (% of cohort)

Diese Statistik in anderen Ländern:
AfghanistanAlbaniaAlgeriaAndorraAngolaAntigua and BarbudaArab WorldArgentinaArubaBahamas, TheBahrainBangladeshBarbadosBelgiumBelizeBeninBermudaBhutanBoliviaBosnia and HerzegovinaBotswanaBrunei DarussalamBurkina FasoBurundiCabo VerdeCambodiaCameroonCanadaCaribbean small statesCayman IslandsCentral African RepublicChadChileChinaColombiaComorosCongo, Dem. Rep.Congo, Rep.Costa RicaCote d'IvoireCubaCyprusCzech RepublicDenmarkDjiboutiDominicaDominican RepublicEarly-demographic dividendEast Asia & PacificEast Asia & Pacific (excluding high income)East Asia & Pacific (IDA & IBRD countries)EcuadorEgypt, Arab Rep.El SalvadorEquatorial GuineaEritreaEstoniaEthiopiaFijiFinlandFranceGabonGambia, TheGeorgiaGhanaGreeceGrenadaGuatemalaGuineaGuinea-BissauGuyanaHaitiHeavily indebted poor countries (HIPC)HondurasHong Kong SAR, ChinaHungaryIcelandIDA blendIDA onlyIDA totalIndiaIndonesiaIran, Islamic Rep.IraqIrelandIsraelItalyJamaicaJapanJordanKenyaKiribatiKorea, Rep.KuwaitLao PDRLate-demographic dividendLatviaLeast developed countries: UN classificationLebanonLesothoLiberiaLibyaLiechtensteinLow incomeLower middle incomeLuxembourgMacao SAR, ChinaMadagascarMalawiMalaysiaMaldivesMaliMaltaMarshall IslandsMauritaniaMauritiusMexicoMiddle East & North AfricaMiddle East & North Africa (excluding high income)Middle East & North Africa (IDA & IBRD countries)MontenegroMoroccoMozambiqueMyanmarNamibiaNepalNetherlandsNicaraguaNigerNigeriaNorwayOmanOther small statesPacific island small statesPakistanPanamaPapua New GuineaParaguayPeruPhilippinesPolandPortugalPre-demographic dividendQatarRwandaSamoaSan MarinoSao Tome and PrincipeSaudi ArabiaSenegalSeychellesSierra LeoneSingaporeSloveniaSolomon IslandsSouth AfricaSouth AsiaSouth Asia (IDA & IBRD)SpainSri LankaSt. Kitts and NevisSt. LuciaSt. Vincent and the GrenadinesSub-Saharan Africa Sub-Saharan Africa (excluding high income)Sub-Saharan Africa (IDA & IBRD countries)SudanSurinameSwazilandSwedenSwitzerlandSyrian Arab RepublicTanzaniaThailandTimor-LesteTogoTongaTrinidad and TobagoTunisiaTurkeyUgandaUnited Arab EmiratesUpper middle incomeUruguayVanuatuVenezuela, RBVietnamYemen, Rep.ZambiaZimbabwe
Zeitlinie:
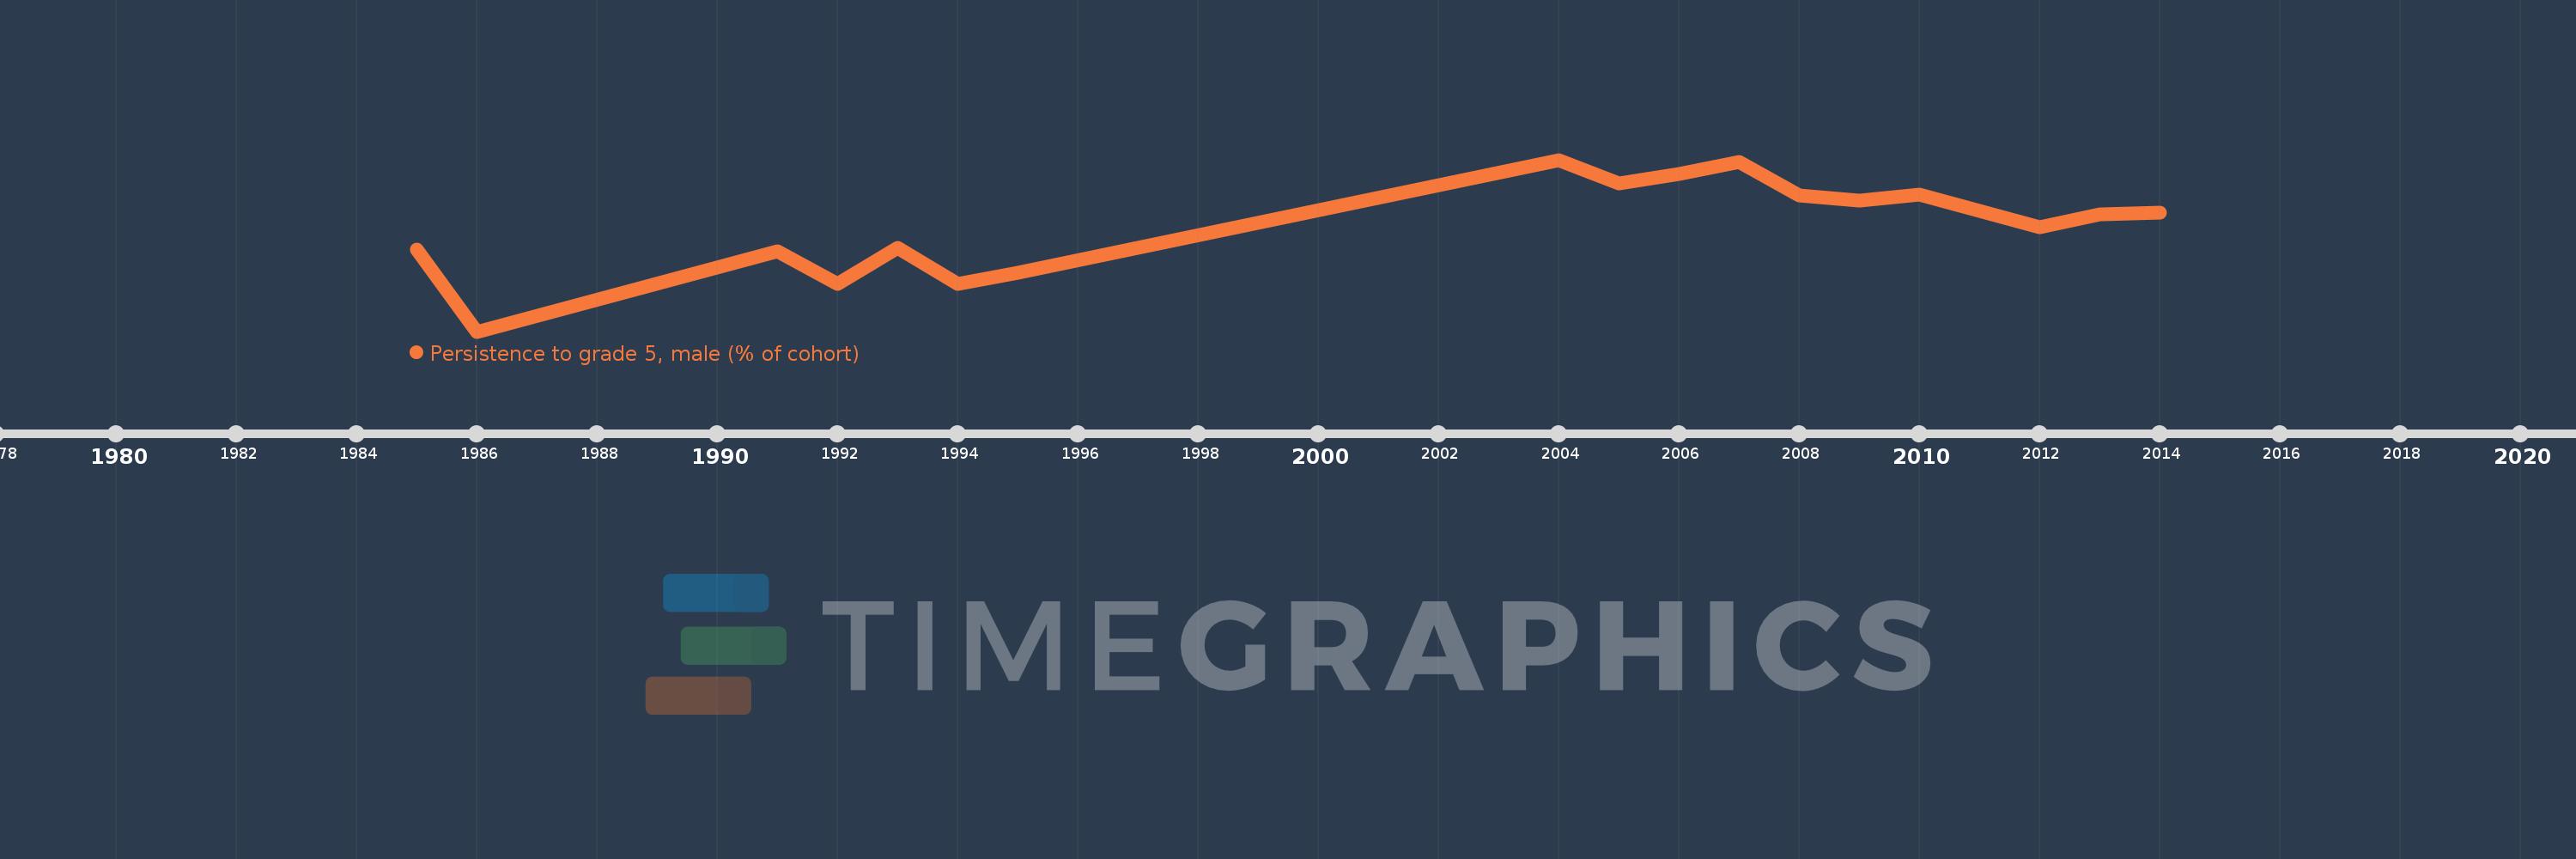
Diese Zeitleiste vorliegt die Graphik ab 1985 J. bis 2014 J. Guinea. Die Angaben bis 1984 J. sind nicht vorhanden. Die Zahl aktueller Beobachtungen nach Daten: 17.
Die Quelle (Bezeichnung):
Kennzahlen der Weltentwicklung
Die Quelle (Einrichtung):
United Nations Educational, Scientific, and Cultural Organization (UNESCO) Institute for Statistics.
Kategorien:
Education, Gender
Es wurde aktualisiert:
23 Apr 2017 Jahr
Kennzahlen der Wertänderungen vom Jahr zum Jahr
im Durchschnitt:
63.354
Minimum:
26.742
1 Jan 1986 Jahr
Maximum:
86.323
1 Jan 2004 Jahr
Zum Datum der Beobachtung
Wert
Absolute Veränderung
Die Veränderung bezüglich dem vorherigen Wert
1 Jan 1985 Jahr
55.325
+55.325
0.0%
1 Jan 1986 Jahr
26.742
-28.583
-51.66%
1 Jan 1991 Jahr
54.61
+27.868
104.21%
1 Jan 1992 Jahr
43.39
-11.219
-20.54%
1 Jan 1993 Jahr
55.902
+12.512
28.83%
1 Jan 1994 Jahr
43.41
-12.492
-22.35%
1 Jan 1995 Jahr
47.291
+3.881
8.94%
1 Jan 2004 Jahr
86.323
+39.032
82.53%
1 Jan 2005 Jahr
78.1
-8.223
-9.53%
1 Jan 2006 Jahr
81.552
+3.452
4.42%
1 Jan 2007 Jahr
85.564
+4.012
4.92%
1 Jan 2008 Jahr
73.928
-11.636
-13.6%
1 Jan 2009 Jahr
72.267
-1.662
-2.25%
1 Jan 2010 Jahr
74.253
+1.986
2.75%
1 Jan 2012 Jahr
62.905
-11.348
-15.28%
1 Jan 2013 Jahr
67.494
+4.59
7.3%
1 Jan 2014 Jahr
67.966
+0.472
0.7%
Bewertung der Länder gemäß mit laufender Statistik nach Jahren

Kommentare:

Abschicken
PremiumAbout & FeedbackVereinbarungPrivatheit
logo
© 2022 Selected Technologies LLC – Morgan Hill, California