29
/de/
de
AIzaSyAYiBZKx7MnpbEhh9jyipgxe19OcubqV5w
April 1, 2024
131443
Faroe Islands
FRO
true
2
1
Fixed broadband subscriptions (per 100 people)
2016,2015,2014,2013,2012,2011,2010,2009,2008,2007,2006,2005,2004,2003,2002
Download
Bibliothek der Globalstatistik →Faroe Islands →

Fixed broadband subscriptions (per 100 people)

Diese Statistik in anderen Ländern:
AfghanistanAlbaniaAlgeriaAndorraAngolaAntigua and BarbudaArab WorldArgentinaArmeniaArubaAustraliaAustriaAzerbaijanBahamas, TheBahrainBangladeshBarbadosBelarusBelgiumBelizeBeninBermudaBhutanBoliviaBosnia and HerzegovinaBotswanaBrazilBritish Virgin IslandsBrunei DarussalamBulgariaBurkina FasoBurundiCabo VerdeCambodiaCameroonCanadaCaribbean small statesCayman IslandsCentral African RepublicCentral Europe and the BalticsChadChileChinaColombiaComorosCongo, Dem. Rep.Congo, Rep.Costa RicaCote d'IvoireCroatiaCubaCuracaoCyprusCzech RepublicDenmarkDjiboutiDominicaDominican RepublicEarly-demographic dividendEast Asia & PacificEast Asia & Pacific (excluding high income)East Asia & Pacific (IDA & IBRD countries)EcuadorEgypt, Arab Rep.El SalvadorEquatorial GuineaEritreaEstoniaEthiopiaEuro areaEurope & Central AsiaEurope & Central Asia (excluding high income)Europe & Central Asia (IDA & IBRD countries)European UnionFaroe IslandsFijiFinlandFragile and conflict affected situationsFranceFrench PolynesiaGabonGambia, TheGeorgiaGermanyGhanaGibraltarGreeceGreenlandGrenadaGuamGuatemalaGuineaGuinea-BissauGuyanaHaitiHeavily indebted poor countries (HIPC)High incomeHondurasHong Kong SAR, ChinaHungaryIBRD onlyIcelandIDA & IBRD totalIDA blendIDA onlyIDA totalIndiaIndonesiaIran, Islamic Rep.IraqIrelandIsraelItalyJamaicaJapanJordanKazakhstanKenyaKiribatiKorea, Rep.KuwaitKyrgyz RepublicLao PDRLate-demographic dividendLatin America & Caribbean Latin America & Caribbean (excluding high income)Latin America & the Caribbean (IDA & IBRD countries)LatviaLeast developed countries: UN classificationLebanonLesothoLiberiaLibyaLiechtensteinLithuaniaLow & middle incomeLow incomeLower middle incomeLuxembourgMacao SAR, ChinaMacedonia, FYRMadagascarMalawiMalaysiaMaldivesMaliMaltaMarshall IslandsMauritaniaMauritiusMexicoMicronesia, Fed. Sts.Middle East & North AfricaMiddle East & North Africa (excluding high income)Middle East & North Africa (IDA & IBRD countries)Middle incomeMoldovaMonacoMongoliaMontenegroMoroccoMozambiqueMyanmarNamibiaNauruNepalNetherlandsNew CaledoniaNew ZealandNicaraguaNigerNigeriaNorth AmericaNorwayOECD membersOmanOther small statesPacific island small statesPakistanPalauPanamaPapua New GuineaParaguayPeruPhilippinesPolandPortugalPost-demographic dividendPre-demographic dividendPuerto RicoQatarRomaniaRussian FederationRwandaSamoaSan MarinoSao Tome and PrincipeSaudi ArabiaSenegalSerbiaSeychellesSingaporeSlovak RepublicSloveniaSmall statesSolomon IslandsSomaliaSouth AfricaSouth AsiaSouth Asia (IDA & IBRD)South SudanSpainSri LankaSt. Kitts and NevisSt. LuciaSt. Vincent and the GrenadinesSub-Saharan Africa Sub-Saharan Africa (excluding high income)Sub-Saharan Africa (IDA & IBRD countries)SudanSurinameSwazilandSwedenSwitzerlandSyrian Arab RepublicTajikistanTanzaniaThailandTimor-LesteTogoTongaTrinidad and TobagoTunisiaTurkeyTurkmenistanTuvaluUgandaUkraineUnited Arab EmiratesUnited KingdomUnited StatesUpper middle incomeUruguayUzbekistanVanuatuVenezuela, RBVietnamVirgin Islands (U.S.)West Bank and GazaWorldYemen, Rep.ZambiaZimbabwe
Zeitlinie:
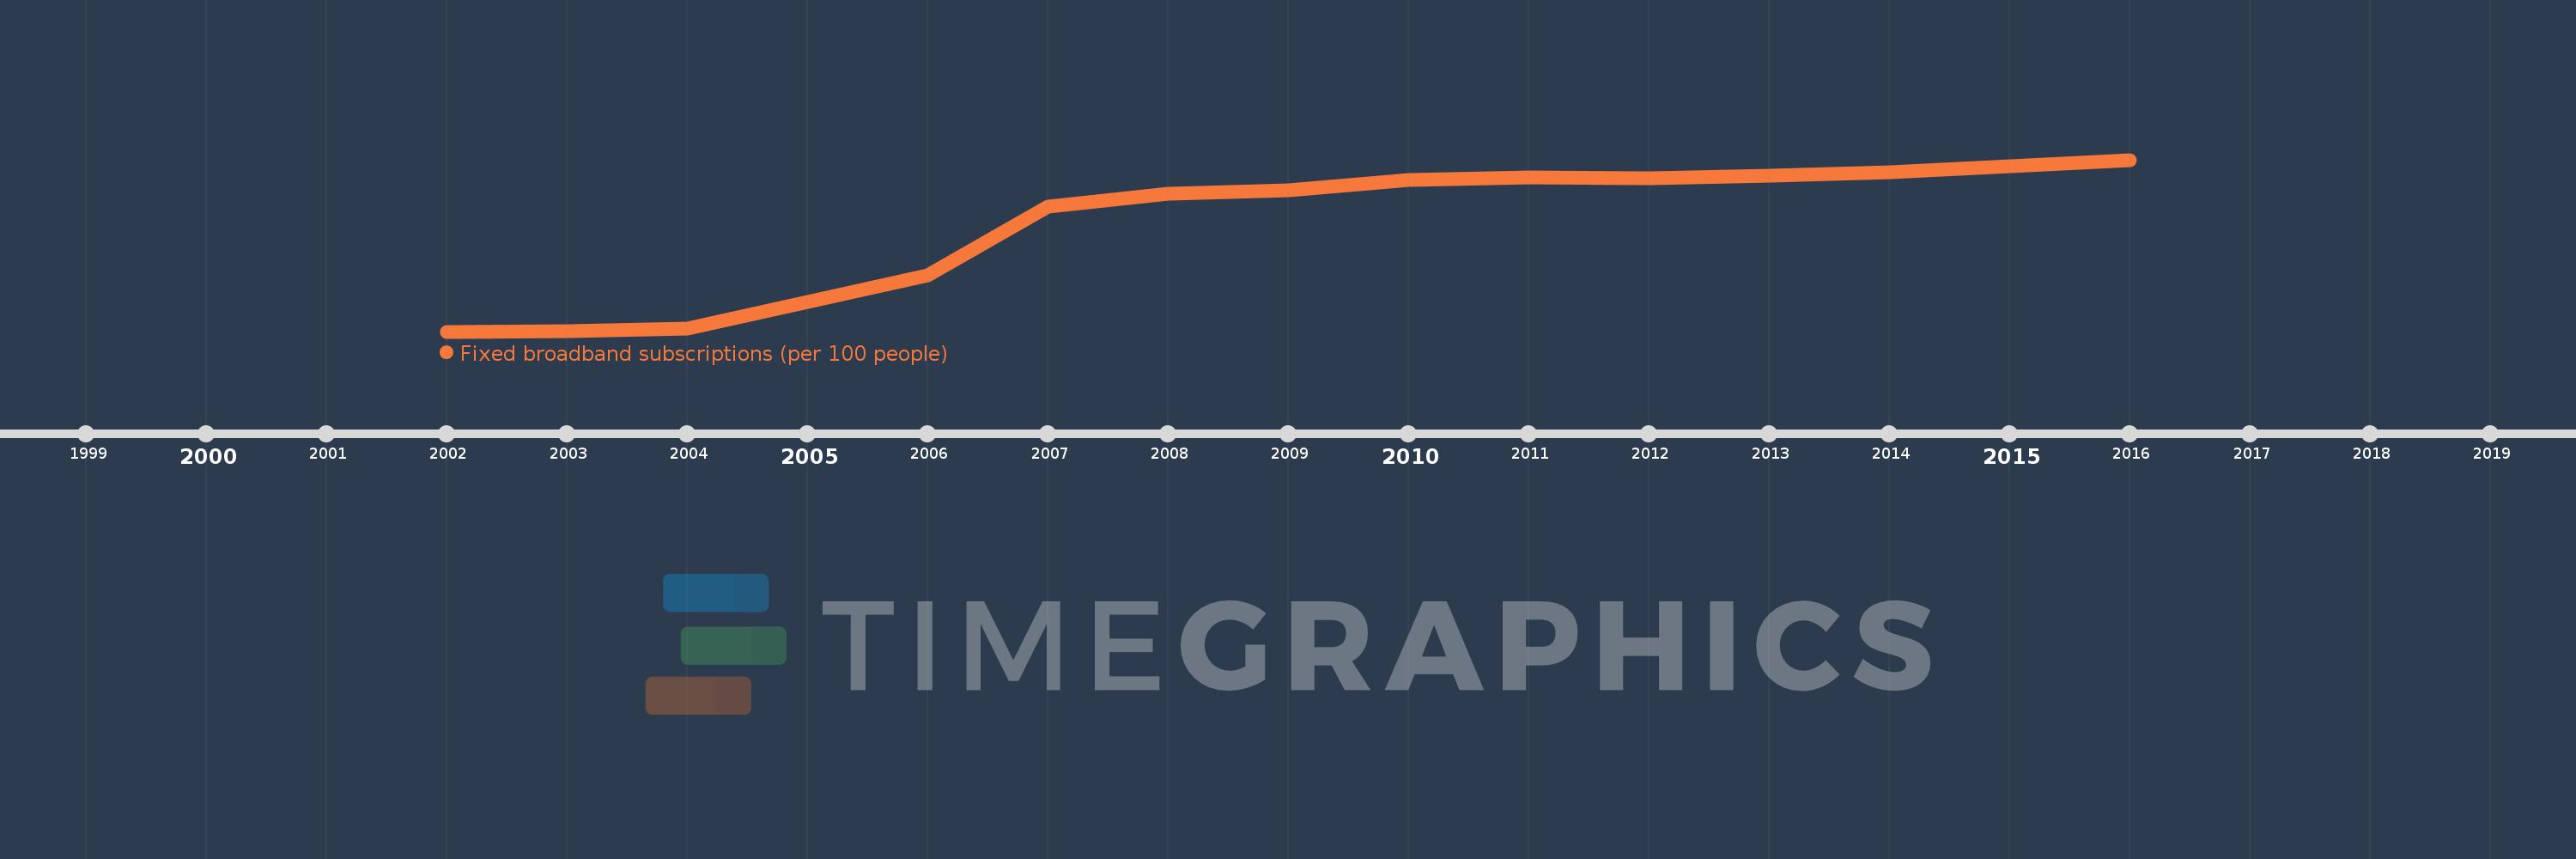
Diese Zeitleiste vorliegt die Graphik ab 2002 J. bis 2016 J. Faroe Islands. Die Angaben bis 2001 J. sind nicht vorhanden. Die Zahl aktueller Beobachtungen nach Daten: 15.
Die Quelle (Bezeichnung):
Kennzahlen der Weltentwicklung
Die Quelle (Einrichtung):
International Telecommunication Union, World Telecommunication/ICT Development Report and database.
Kategorien:
Infrastructure
Es wurde aktualisiert:
23 Apr 2017 Jahr
Kennzahlen der Wertänderungen vom Jahr zum Jahr
im Durchschnitt:
22.694
Minimum:
0.115
1 Jan 2002 Jahr
Maximum:
36.367
1 Jan 2016 Jahr
Zum Datum der Beobachtung
Wert
Absolute Veränderung
Die Veränderung bezüglich dem vorherigen Wert
1 Jan 2002 Jahr
0.115
+0.115
0.0%
1 Jan 2003 Jahr
0.239
+0.124
108.39%
1 Jan 2004 Jahr
0.816
+0.577
241.63%
1 Jan 2005 Jahr
6.425
+5.609
687.7%
1 Jan 2006 Jahr
11.937
+5.513
85.81%
1 Jan 2007 Jahr
26.567
+14.63
122.56%
1 Jan 2008 Jahr
29.186
+2.619
9.86%
1 Jan 2009 Jahr
29.995
+0.809
2.77%
1 Jan 2010 Jahr
32.02
+2.025
6.75%
1 Jan 2011 Jahr
32.631
+0.611
1.91%
1 Jan 2012 Jahr
32.405
-0.226
-0.69%
1 Jan 2013 Jahr
32.974
+0.569
1.76%
1 Jan 2014 Jahr
33.759
+0.785
2.38%
1 Jan 2015 Jahr
34.982
+1.223
3.62%
1 Jan 2016 Jahr
36.367
+1.385
3.96%
Bewertung der Länder gemäß mit laufender Statistik nach Jahren

Kommentare:

Abschicken
PremiumAbout & FeedbackVereinbarungPrivatheit
logo
© 2022 Selected Technologies LLC – Morgan Hill, California