33
/de/
AIzaSyAYiBZKx7MnpbEhh9jyipgxe19OcubqV5w
August 1, 2025
130157
Ethiopia
ETH
true
2
1
Charges for the use of intellectual property, payments (BoP, current US$)
2013,2012,2011,2010,2009,2008,2007,2006,2005,2004,2003,2002,2001,2000,1997,1978
Download
Bibliothek der Globalstatistik →Ethiopia →

Charges for the use of intellectual property, payments (BoP, current US$)

Diese Statistik in anderen Ländern:

AfghanistanAlbaniaAlgeriaAngolaAntigua and BarbudaArab WorldArgentinaArubaAustraliaAustriaAzerbaijanBahamas, TheBangladeshBarbadosBelarusBelgiumBelizeBeninBermudaBhutanBoliviaBosnia and HerzegovinaBotswanaBrazilBrunei DarussalamBulgariaBurkina FasoBurundiCabo VerdeCambodiaCameroonCanadaCaribbean small statesCentral Europe and the BalticsChileChinaColombiaCongo, Dem. Rep.Costa RicaCote d'IvoireCroatiaCuracaoCyprusCzech RepublicDenmarkDominicaDominican RepublicEarly-demographic dividendEast Asia & PacificEast Asia & Pacific (excluding high income)East Asia & Pacific (IDA & IBRD countries)EcuadorEgypt, Arab Rep.El SalvadorEritreaEstoniaEthiopiaEuro areaEurope & Central AsiaEurope & Central Asia (excluding high income)Europe & Central Asia (IDA & IBRD countries)European UnionFaroe IslandsFijiFinlandFragile and conflict affected situationsFranceFrench PolynesiaGeorgiaGermanyGhanaGreeceGrenadaGuatemalaGuineaGuinea-BissauGuyanaHaitiHeavily indebted poor countries (HIPC)High incomeHondurasHong Kong SAR, ChinaHungaryIBRD onlyIcelandIDA & IBRD totalIDA blendIDA onlyIDA totalIndiaIndonesiaIraqIrelandIsraelItalyJamaicaJapanJordanKazakhstanKenyaKorea, Rep.KosovoKyrgyz RepublicLate-demographic dividendLatin America & Caribbean Latin America & Caribbean (excluding high income)Latin America & the Caribbean (IDA & IBRD countries)LatviaLeast developed countries: UN classificationLebanonLesothoLithuaniaLow & middle incomeLow incomeLower middle incomeLuxembourgMacao SAR, ChinaMacedonia, FYRMadagascarMalawiMalaysiaMaldivesMaliMaltaMauritaniaMauritiusMexicoMiddle East & North AfricaMiddle East & North Africa (excluding high income)Middle East & North Africa (IDA & IBRD countries)Middle incomeMoldovaMongoliaMontenegroMoroccoMozambiqueMyanmarNamibiaNetherlandsNew CaledoniaNew ZealandNicaraguaNigerNigeriaNorth AmericaNorwayOECD membersOther small statesPacific island small statesPakistanPanamaPapua New GuineaParaguayPeruPhilippinesPolandPortugalPost-demographic dividendPre-demographic dividendRomaniaRussian FederationRwandaSamoaSao Tome and PrincipeSenegalSerbiaSeychellesSierra LeoneSingaporeSint Maarten (Dutch part)Slovak RepublicSloveniaSmall statesSolomon IslandsSouth AfricaSouth AsiaSouth Asia (IDA & IBRD)South SudanSpainSt. Kitts and NevisSt. LuciaSt. Vincent and the GrenadinesSub-Saharan Africa Sub-Saharan Africa (excluding high income)Sub-Saharan Africa (IDA & IBRD countries)SudanSurinameSwazilandSwedenSwitzerlandSyrian Arab RepublicTajikistanTanzaniaThailandTimor-LesteTogoTongaTrinidad and TobagoTunisiaTurkeyUgandaUkraineUnited KingdomUnited StatesUpper middle incomeUruguayVanuatuVenezuela, RBWest Bank and GazaWorldYemen, Rep.ZambiaZimbabwe

Zeitlinie:

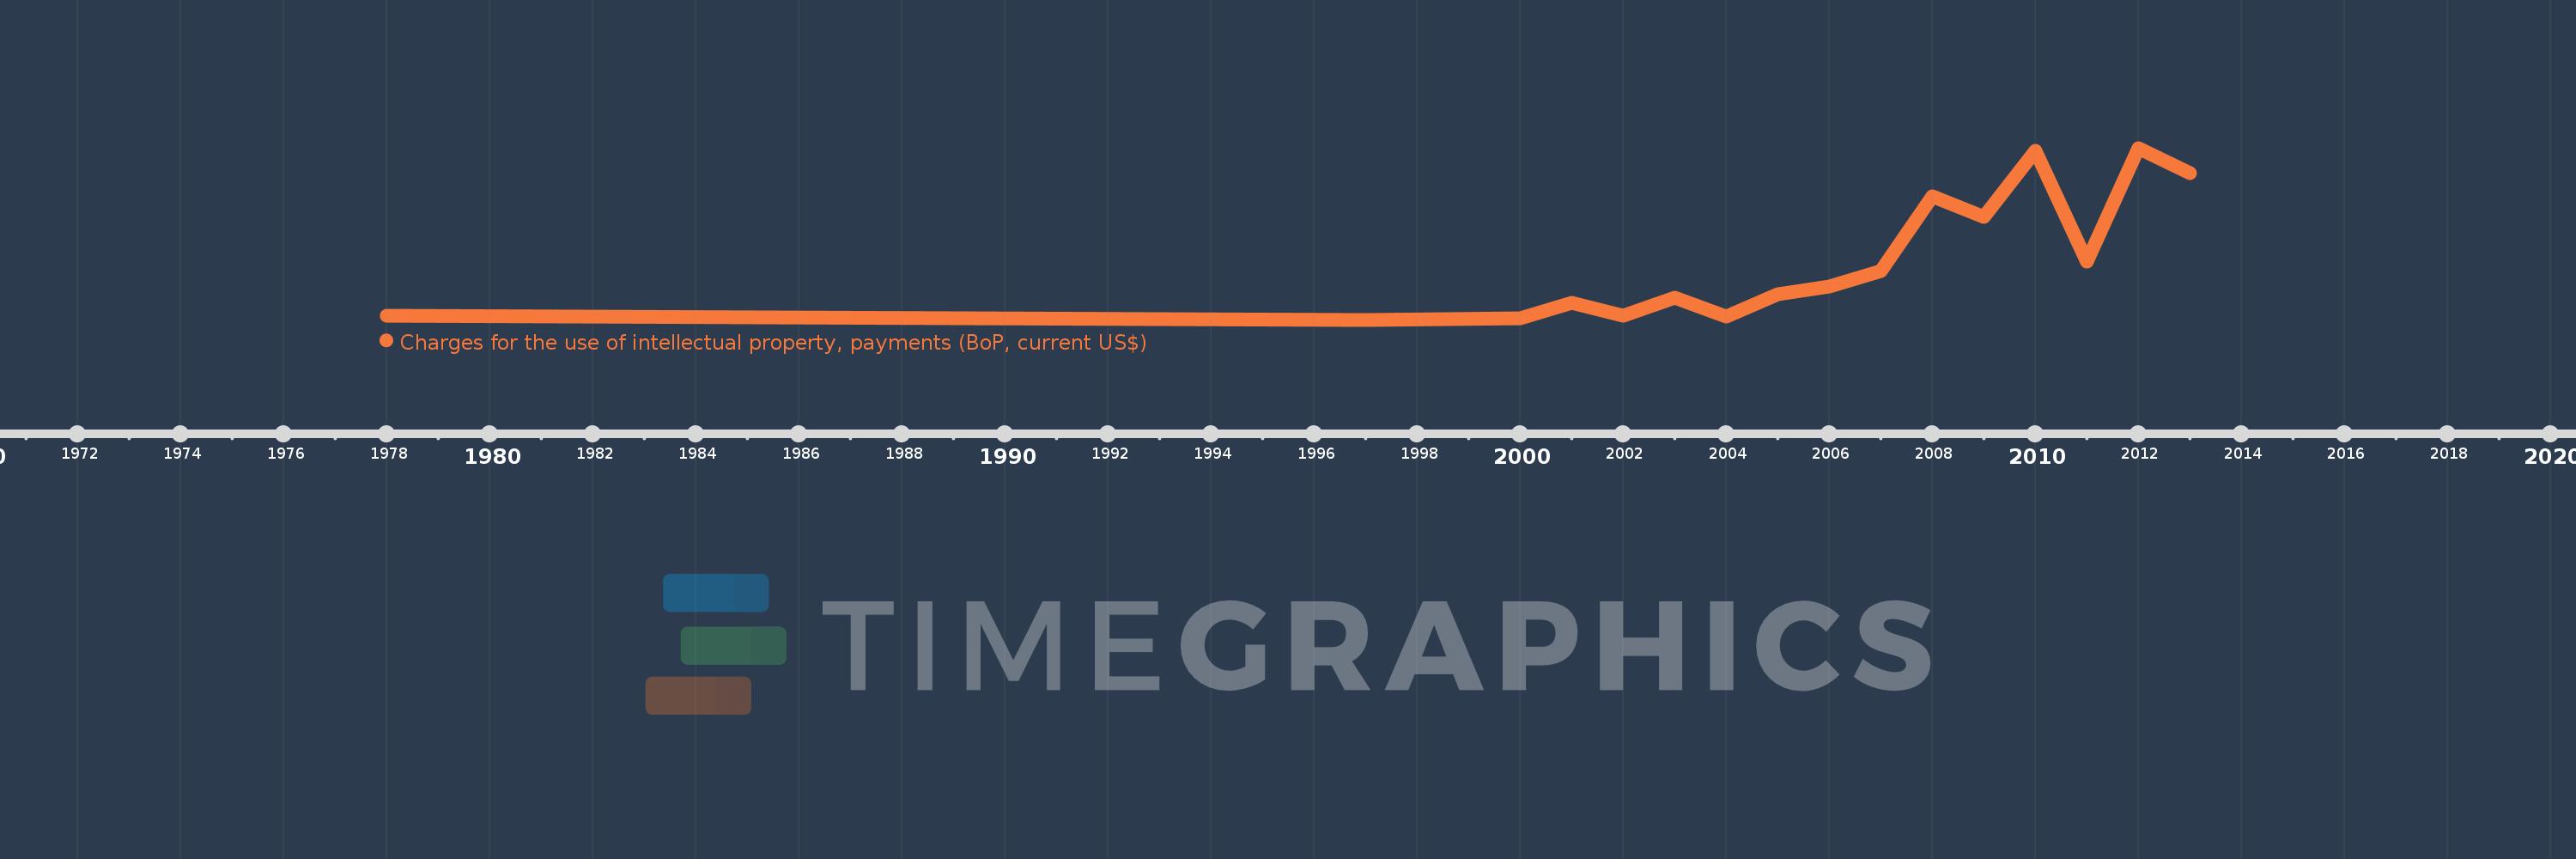
Diese Zeitleiste vorliegt die Graphik ab 1978 J. bis 2013 J. Ethiopia. Die Angaben bis 1977 J. sind nicht vorhanden. Die Zahl aktueller Beobachtungen nach Daten: 16.

Die Quelle (Bezeichnung):

Kennzahlen der Weltentwicklung

Die Quelle (Einrichtung):

International Monetary Fund, Balance of Payments Statistics Yearbook and data files.

Kategorien:

Economy & Growth, Science & Technology

Es wurde aktualisiert:

23 Apr 2017 Jahr

Kennzahlen der Wertänderungen vom Jahr zum Jahr

im Durchschnitt:
994.222 Tsnd.
Minimum:
31.518 Tsnd.
1 Jan 1997 Jahr
Maximum:
2.877 Mln.
1 Jan 2012 Jahr
Zum Datum der Beobachtung
Wert
Absolute Veränderung
Die Veränderung bezüglich dem vorherigen Wert
1 Jan 1978 Jahr
96.618 Tsnd.
+96.618 Tsnd.
0.0%
1 Jan 1997 Jahr
31.518 Tsnd.
-65.1 Tsnd.
-67.38%
1 Jan 2000 Jahr
52.684 Tsnd.
+21.165 Tsnd.
67.15%
1 Jan 2001 Jahr
316.615 Tsnd.
+263.931 Tsnd.
500.97%
1 Jan 2002 Jahr
101.147 Tsnd.
-215.468 Tsnd.
-68.05%
1 Jan 2003 Jahr
396.118 Tsnd.
+294.971 Tsnd.
291.63%
1 Jan 2004 Jahr
88.288 Tsnd.
-307.829 Tsnd.
-77.71%
1 Jan 2005 Jahr
450.079 Tsnd.
+361.791 Tsnd.
409.78%
1 Jan 2006 Jahr
575.608 Tsnd.
+125.529 Tsnd.
27.89%
1 Jan 2007 Jahr
844.549 Tsnd.
+268.941 Tsnd.
46.72%
1 Jan 2008 Jahr
2.071 Mln.
+1.226 Mln.
145.17%
1 Jan 2009 Jahr
1.729 Mln.
-341.76 Tsnd.
-16.51%
1 Jan 2010 Jahr
2.826 Mln.
+1.097 Mln.
63.47%
1 Jan 2011 Jahr
993.167 Tsnd.
-1.833 Mln.
-64.86%
1 Jan 2012 Jahr
2.877 Mln.
+1.884 Mln.
189.71%
1 Jan 2013 Jahr
2.458 Mln.
-418.83 Tsnd.
-14.56%

Bewertung der Länder gemäß mit laufender Statistik nach Jahren