33
/de/
AIzaSyB4mHJ5NPEv-XzF7P6NDYXjlkCWaeKw5bc
November 30, 2025
126853
El Salvador
SLV
true
2
1
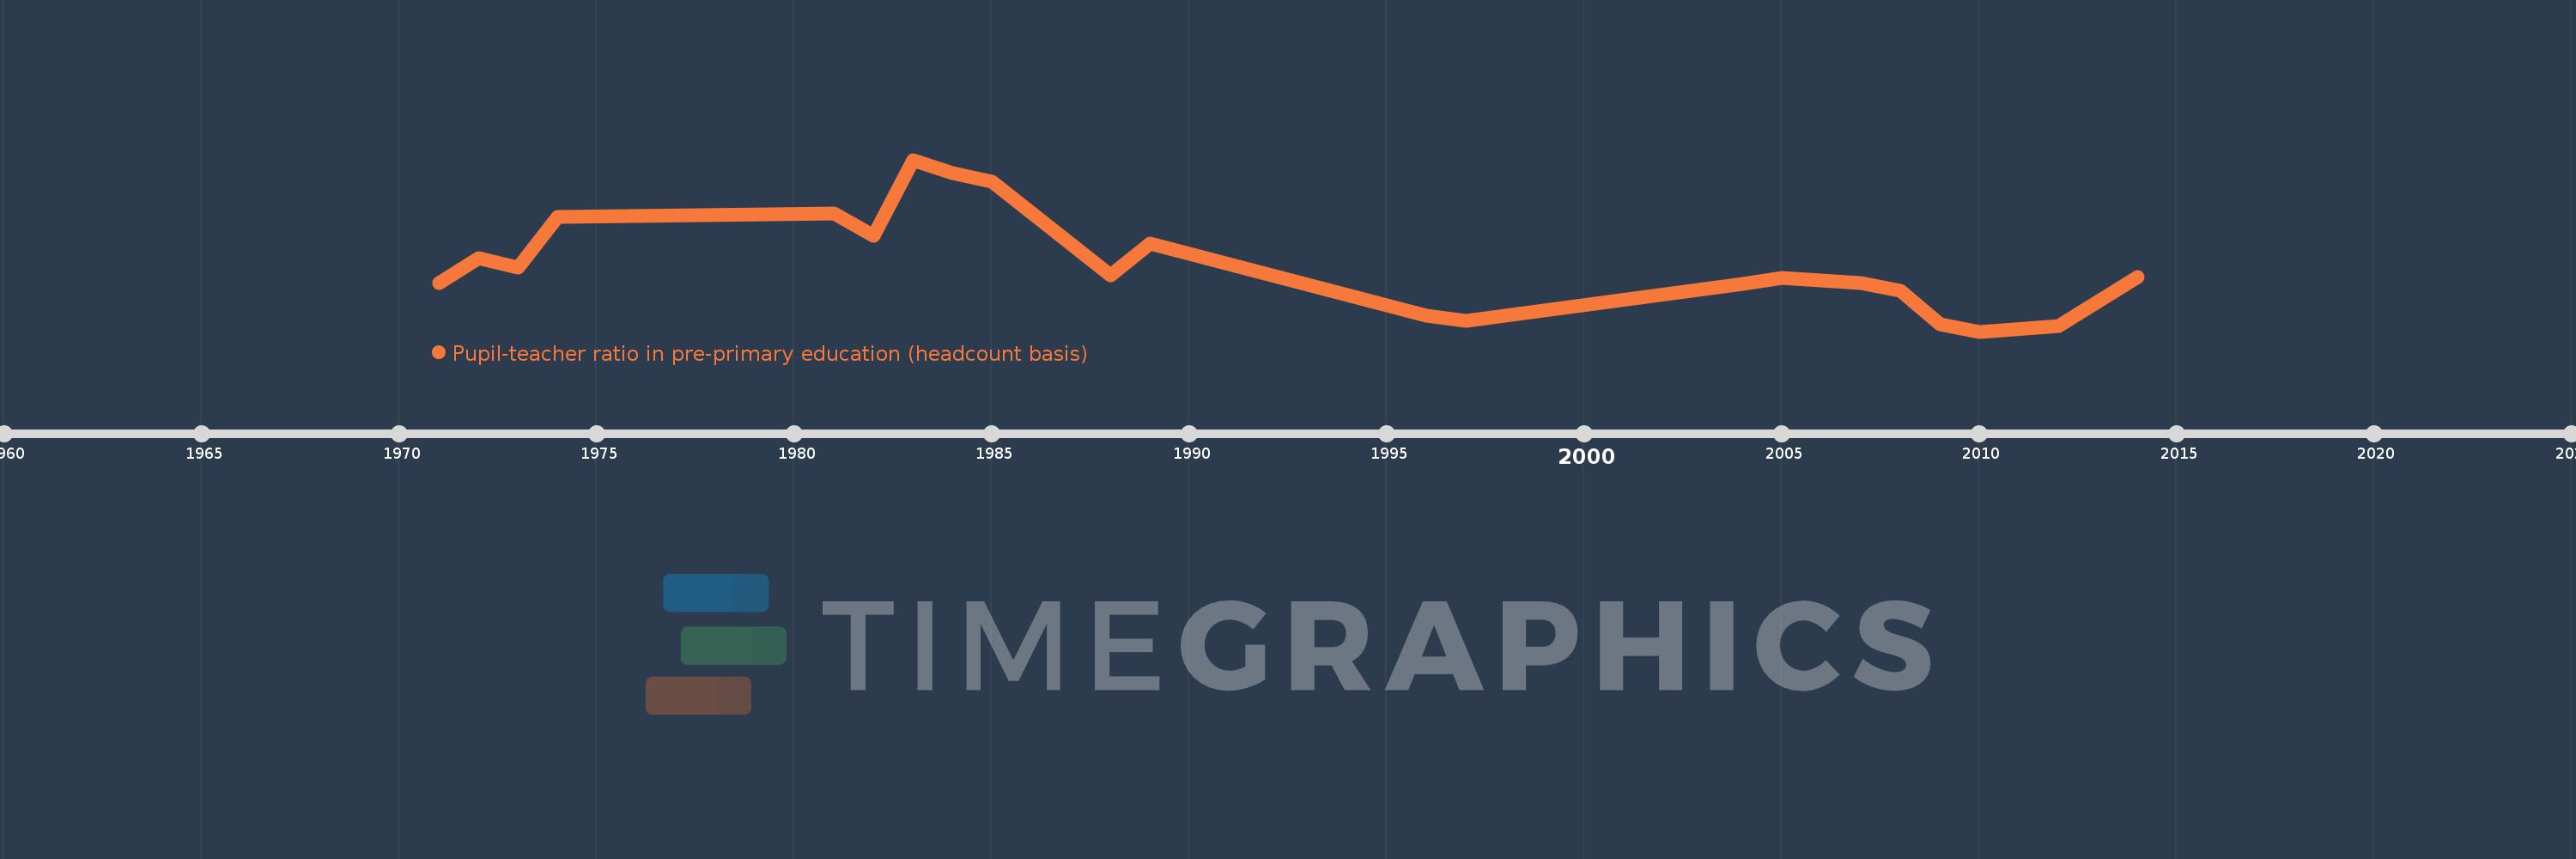
Pupil-teacher ratio in pre-primary education (headcount basis)
2014,2012,2010,2009,2008,2007,2006,2005,2004,1997,1996,1989,1988,1985,1984,1983,1982,1981,1974,1973,1972,1971