Download Diese Statistik in anderen Ländern:
Zeitlinie:
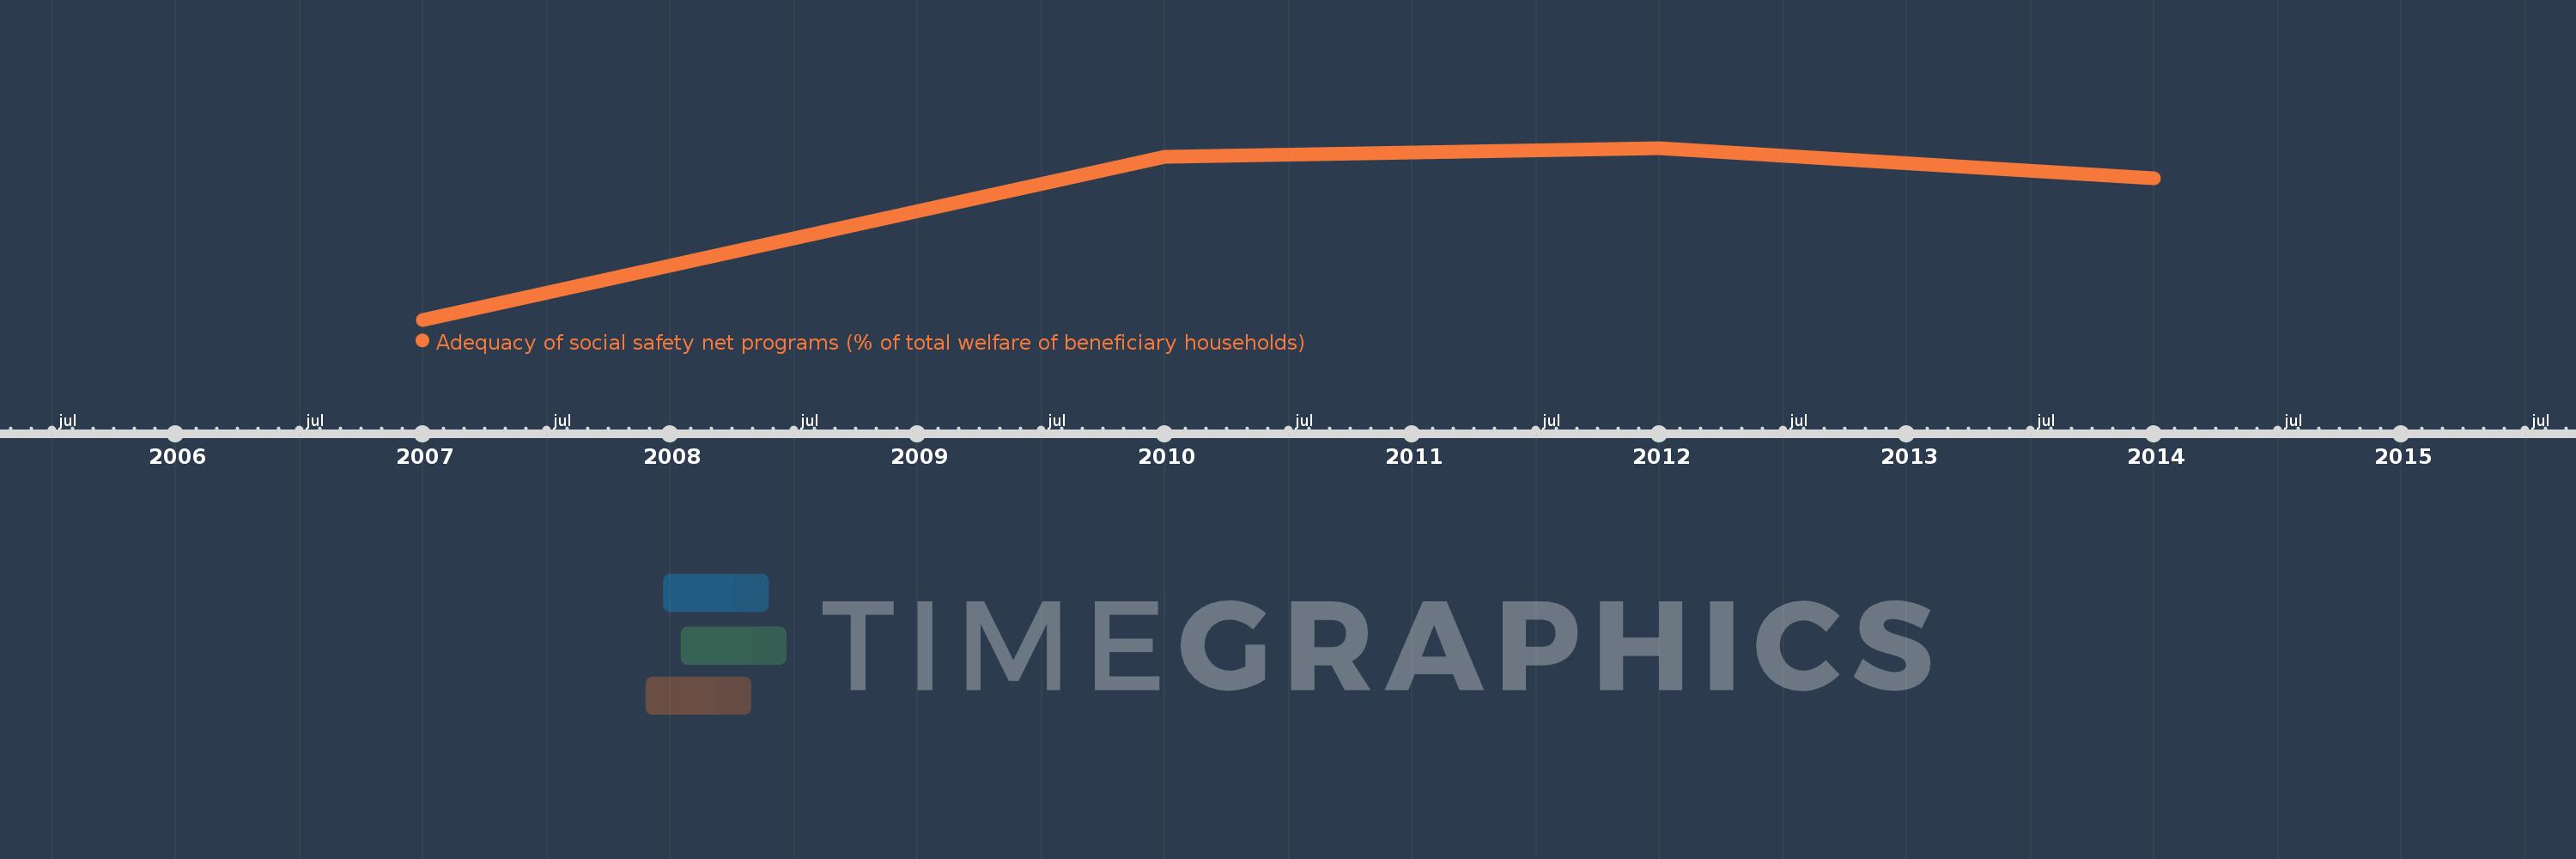
Diese Zeitleiste vorliegt die Graphik ab 2007 J. bis 2014 J. Chile. Die Angaben bis 2006 J. sind nicht vorhanden. Die Zahl aktueller Beobachtungen nach Daten: 4.
Die Quelle (Bezeichnung):
Kennzahlen der Weltentwicklung
Die Quelle (Einrichtung):
The Atlas of Social Protection: Indicators of Resilience and Equity (ASPIRE)
Kategorien:
Social Protection & Labor
Es wurde aktualisiert:
23 Apr 2017 Jahr
Kennzahlen der Wertänderungen vom Jahr zum Jahr
Minimum:
4.404
1 Jan 2007 Jahr
Maximum:
7.342
1 Jan 2012 Jahr
Zum Datum der Beobachtung
Wert
Absolute Veränderung
Die Veränderung bezüglich dem vorherigen Wert
1 Jan 2007 Jahr
4.404
+4.404
0.0%
1 Jan 2010 Jahr
7.196
+2.792
63.38%
1 Jan 2012 Jahr
7.342
+0.146
2.03%
1 Jan 2014 Jahr
6.818
-0.524
-7.13%
Bewertung der Länder gemäß mit laufender Statistik nach Jahren