29
/
en
AIzaSyAYiBZKx7MnpbEhh9jyipgxe19OcubqV5w
April 1, 2024
94121
Bulgaria
BGR
true
2
1
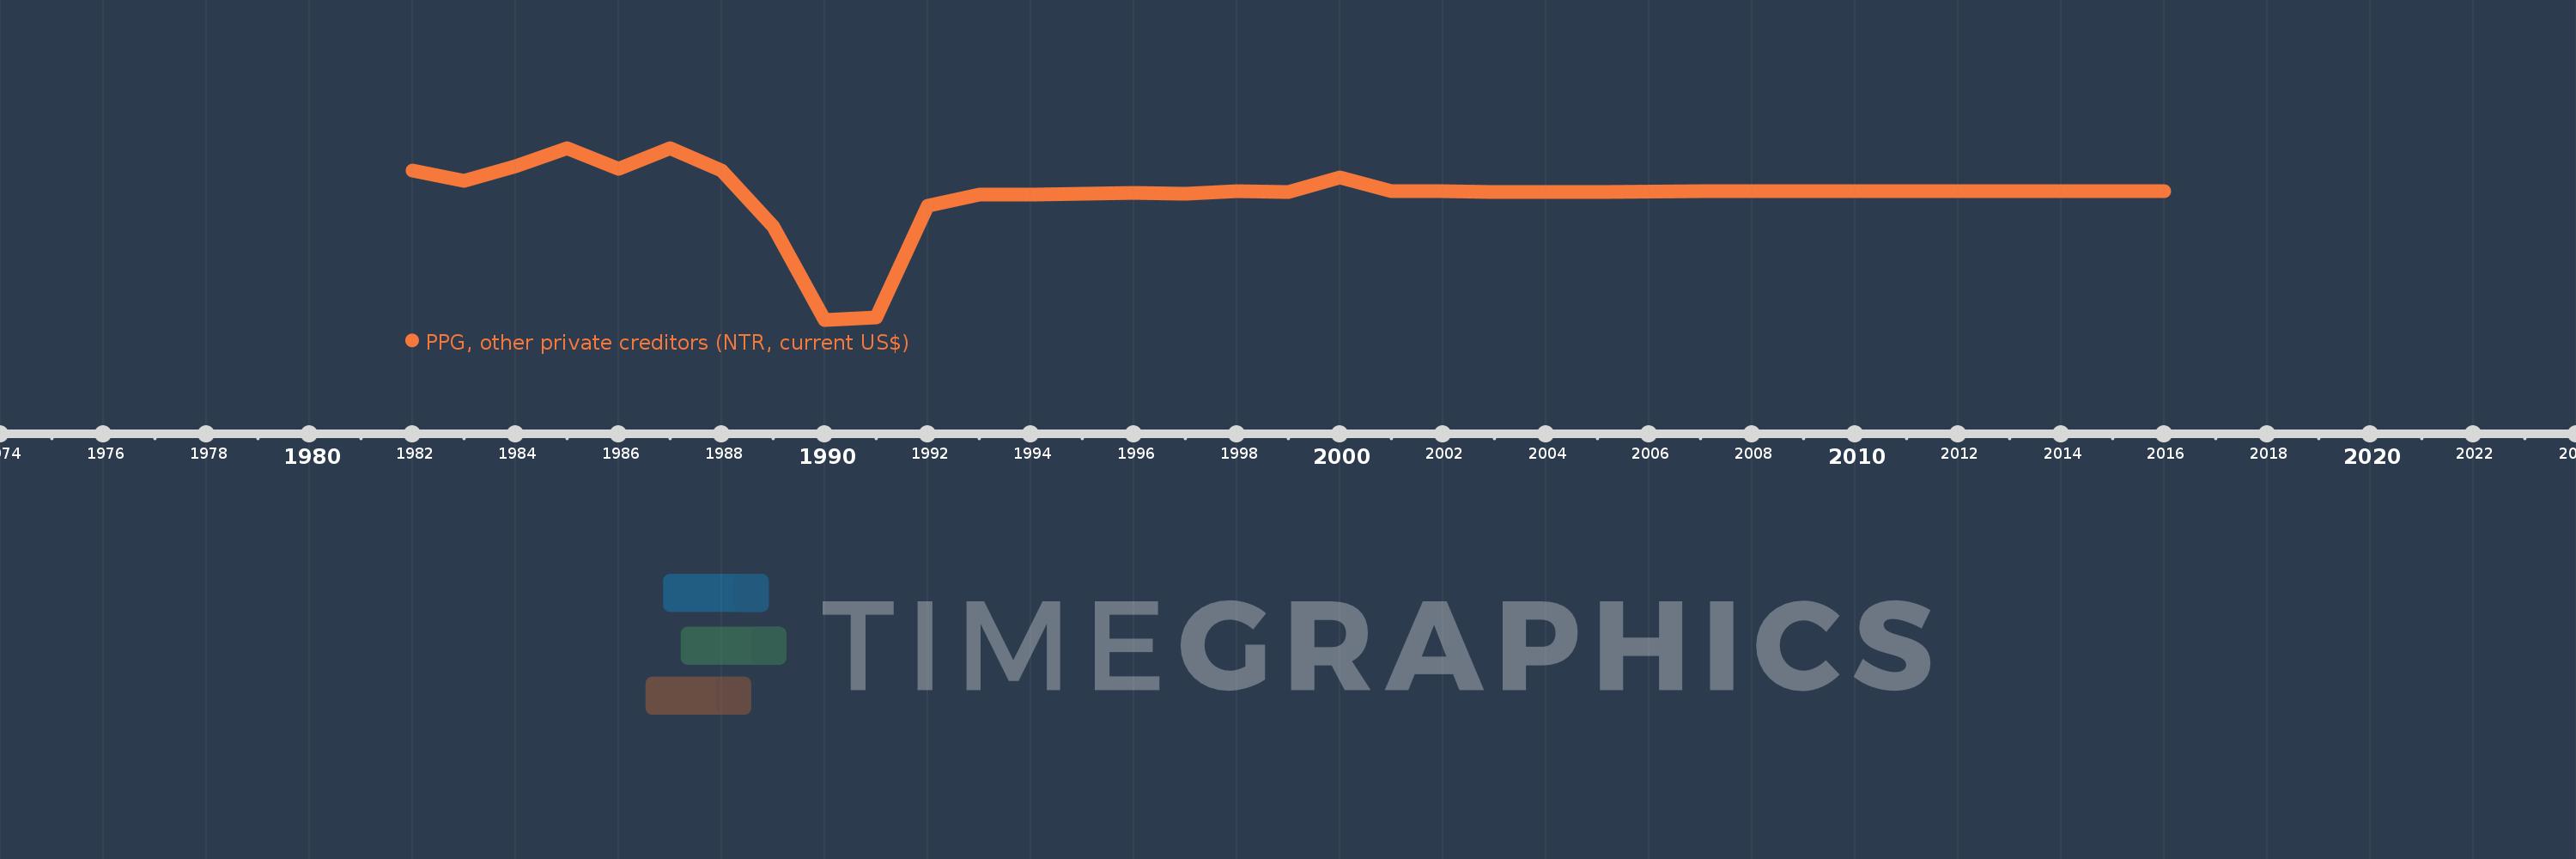
PPG, other private creditors (NTR, current US$)
2016,2015,2014,2013,2012,2011,2010,2009,2008,2007,2005,2004,2003,2002,2001,2000,1999,1998,1997,1996,1994,1993,1992,1991,1990,1989,1988,1987,1986,1985,1984,1983,1982
This statistics in other country:
Timeline:
This timeline shows a graph from 1982 to 2016 of Bulgaria. No data until 1981. Number of actual observations by date: 33.
Source name:
World Development Indicators
Source organization:
World Bank, International Debt Statistics.
Categories, topics:
External Debt
Last updated:
apr 23, 2017
Indicators value changes by year
Minimum:
-620.227 mln
jan 1, 1990
Maximum:
209.206 mln
jan 1, 1985
At the date of observation
Value
Absolute change
Change from previous value
jan 1, 1982
100.389 mln
+100.389 mln
0.0%
jan 1, 1983
48.428 mln
-51.961 mln
-51.76%
jan 1, 1984
120.512 mln
+72.084 mln
148.85%
jan 1, 1985
209.206 mln
+88.694 mln
73.6%
jan 1, 1986
110.363 mln
-98.843 mln
-47.25%
jan 1, 1987
206.208 mln
+95.845 mln
86.85%
jan 1, 1988
99.559 mln
-106.649 mln
-51.72%
jan 1, 1989
-169.392 mln
-268.951 mln
-270.14%
jan 1, 1990
-620.227 mln
-450.835 mln
266.15%
jan 1, 1991
-607.594 mln
+12.633 mln
-2.04%
jan 1, 1992
-70.458 mln
+537.136 mln
-88.4%
jan 1, 1993
-14.051 mln
+56.407 mln
-80.06%
jan 1, 1994
-16.483 mln
-2.432 mln
17.31%
jan 1, 1996
-7.357 mln
+9.126 mln
-55.37%
jan 1, 1997
-12.288 mln
-4.931 mln
67.02%
jan 1, 1998
1.16 mln
+13.448 mln
-109.44%
jan 1, 1999
-2.345 mln
-3.505 mln
-302.16%
jan 1, 2000
66.328 mln
+68.673 mln
-2.93K%
jan 1, 2001
-1.337 mln
-67.665 mln
-102.02%
jan 1, 2002
-1.153 mln
+184.0K
-13.76%
jan 1, 2003
-3.851 mln
-2.698 mln
234.0%
jan 1, 2004
-3.723 mln
+128.0K
-3.32%
jan 1, 2005
-3.332 mln
+391.0K
-10.5%
jan 1, 2007
1.337 mln
+4.669 mln
-140.13%
jan 1, 2008
-118.0K
-1.455 mln
-108.83%
jan 1, 2009
-231.0K
-113.0K
95.76%
jan 1, 2010
-210.0K
+21.0K
-9.09%
jan 1, 2011
-194.0K
+16.0K
-7.62%
jan 1, 2012
-195.0K
-1000.0
0.52%
jan 1, 2013
-172.0K
+23.0K
-11.79%
jan 1, 2014
-174.0K
-2.0K
1.16%
jan 1, 2015
-160.0K
+14.0K
-8.05%
jan 1, 2016
-132.0K
+28.0K
-17.5%
Ranking of countries by current statistics by years


Comments: