29
/
en
AIzaSyAYiBZKx7MnpbEhh9jyipgxe19OcubqV5w
April 1, 2024
88907
Bosnia and Herzegovina
BIH
true
2
1
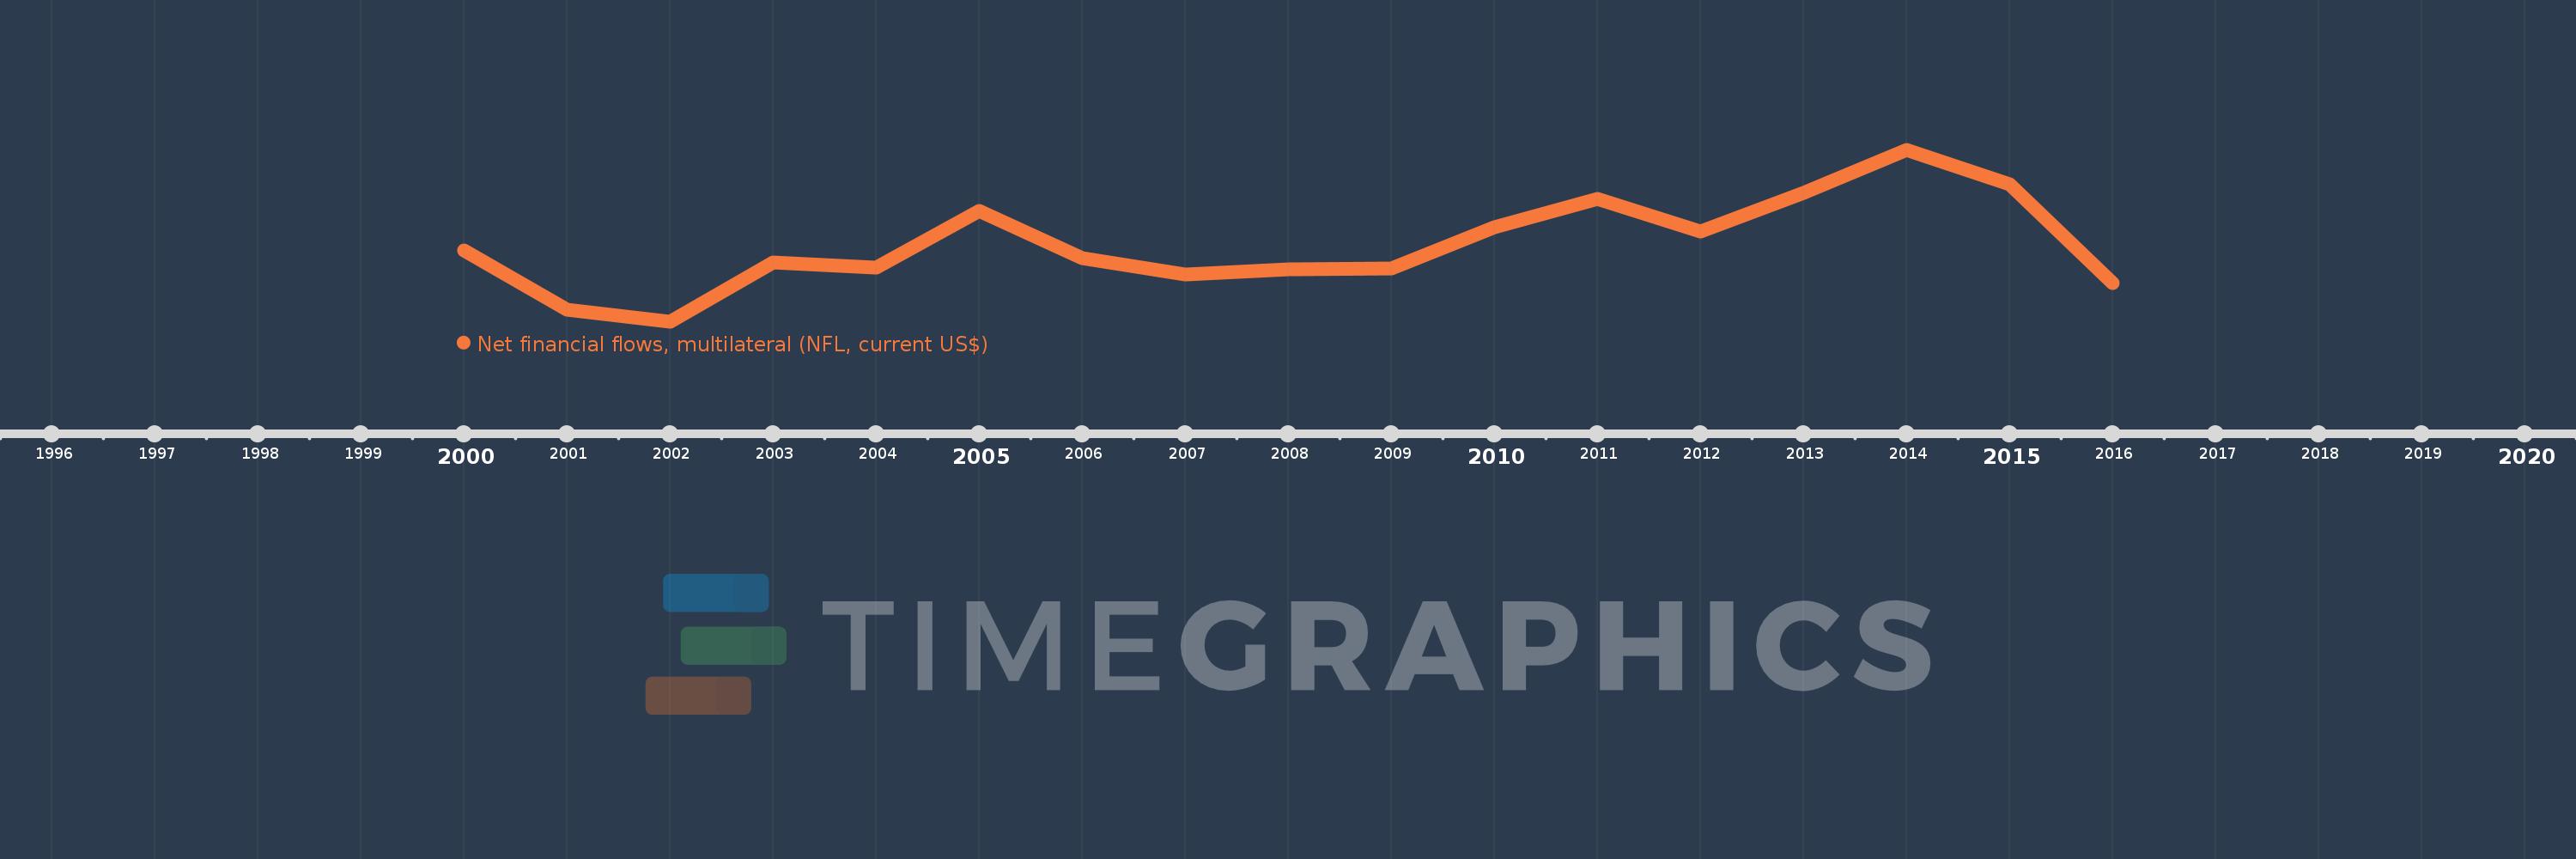
Net financial flows, multilateral (NFL, current US$)
2016,2015,2014,2013,2012,2011,2010,2009,2008,2007,2006,2005,2004,2003,2002,2001,2000
This statistics in other country:
Timeline:
This timeline shows a graph from 2000 to 2016 of Bosnia and Herzegovina. No data until 1999. Number of actual observations by date: 17.
Source name:
World Development Indicators
Source organization:
World Bank, International Debt Statistics.
Categories, topics:
External Debt
Last updated:
apr 23, 2017
Indicators value changes by year
Minimum:
-113.789 mln
jan 1, 2002
Maximum:
432.786 mln
jan 1, 2014
At the date of observation
Value
Absolute change
Change from previous value
jan 1, 2000
114.061 mln
+114.061 mln
0.0%
jan 1, 2001
-75.886 mln
-189.947 mln
-166.53%
jan 1, 2002
-113.789 mln
-37.903 mln
49.95%
jan 1, 2003
76.111 mln
+189.9 mln
-166.89%
jan 1, 2004
57.939 mln
-18.172 mln
-23.88%
jan 1, 2005
239.945 mln
+182.006 mln
314.13%
jan 1, 2006
88.018 mln
-151.927 mln
-63.32%
jan 1, 2007
37.946 mln
-50.072 mln
-56.89%
jan 1, 2008
54.828 mln
+16.882 mln
44.49%
jan 1, 2009
57.188 mln
+2.36 mln
4.3%
jan 1, 2010
186.619 mln
+129.431 mln
226.33%
jan 1, 2011
277.589 mln
+90.97 mln
48.75%
jan 1, 2012
174.858 mln
-102.731 mln
-37.01%
jan 1, 2013
298.27 mln
+123.412 mln
70.58%
jan 1, 2014
432.786 mln
+134.516 mln
45.1%
jan 1, 2015
324.876 mln
-107.91 mln
-24.93%
jan 1, 2016
10.18 mln
-314.696 mln
-96.87%
Ranking of countries by current statistics by years


Comments: