29
/
en
AIzaSyAYiBZKx7MnpbEhh9jyipgxe19OcubqV5w
April 1, 2024
85385
Bermuda
BMU
true
2
1
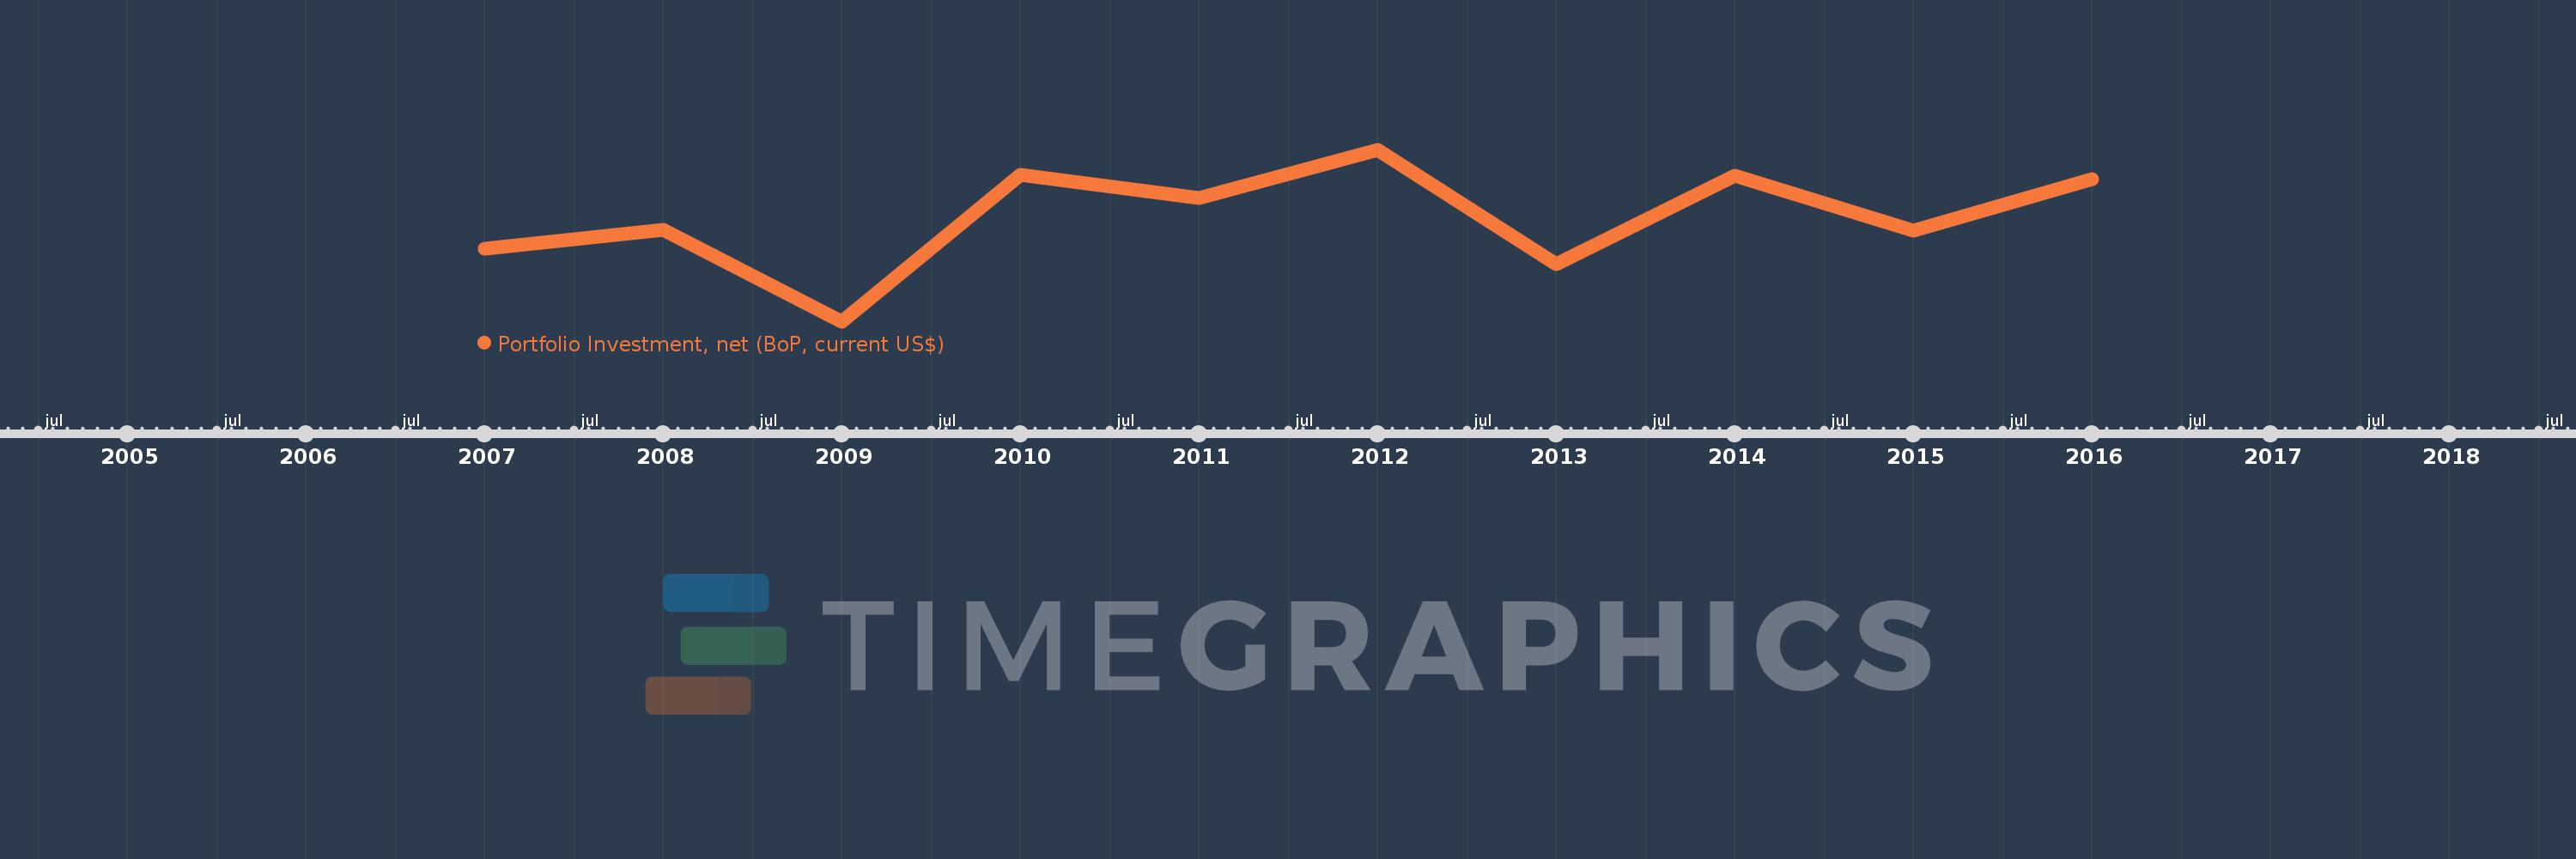
Portfolio Investment, net (BoP, current US$)
2016,2015,2014,2013,2012,2011,2010,2009,2008,2007
This statistics in other country:
AfghanistanAlbaniaAlgeriaAngolaAntigua and BarbudaArgentinaArmeniaArubaAustraliaAustriaAzerbaijanBahamas, TheBahrainBangladeshBarbadosBelarusBelgiumBelizeBeninBermudaBoliviaBosnia and HerzegovinaBotswanaBrazilBrunei DarussalamBulgariaBurkina FasoBurundiCabo VerdeCambodiaCameroonCanadaChileChinaColombiaComorosCongo, Dem. Rep.Congo, Rep.Costa RicaCote d'IvoireCroatiaCuracaoCyprusCzech RepublicDenmarkDominicaDominican RepublicEcuadorEgypt, Arab Rep.El SalvadorEstoniaEuro areaFijiFinlandFranceFrench PolynesiaGabonGeorgiaGermanyGhanaGreeceGrenadaGuatemalaGuineaGuinea-BissauGuyanaHondurasHong Kong SAR, ChinaHungaryIcelandIndiaIndonesiaIraqIrelandIsraelItalyJamaicaJapanJordanKazakhstanKenyaKiribatiKorea, Rep.KosovoKuwaitKyrgyz RepublicLao PDRLatviaLebanonLesothoLiberiaLibyaLithuaniaLuxembourgMacao SAR, ChinaMacedonia, FYRMadagascarMalawiMalaysiaMaldivesMaliMaltaMarshall IslandsMauritaniaMauritiusMexicoMicronesia, Fed. Sts.MoldovaMongoliaMontenegroMoroccoMozambiqueMyanmarNamibiaNetherlandsNew CaledoniaNew ZealandNicaraguaNigerNigeriaNorwayOmanPakistanPalauPanamaPapua New GuineaParaguayPeruPhilippinesPolandPortugalQatarRomaniaRussian FederationRwandaSamoaSao Tome and PrincipeSaudi ArabiaSenegalSerbiaSeychellesSierra LeoneSingaporeSint Maarten (Dutch part)Slovak RepublicSloveniaSolomon IslandsSouth AfricaSpainSri LankaSt. Kitts and NevisSt. LuciaSt. Vincent and the GrenadinesSudanSurinameSwazilandSwedenSwitzerlandSyrian Arab RepublicTajikistanTanzaniaThailandTimor-LesteTogoTongaTrinidad and TobagoTunisiaTurkeyTuvaluUgandaUkraineUnited KingdomUnited StatesUruguayVanuatuVenezuela, RBVietnamWest Bank and GazaYemen, Rep.ZambiaZimbabwe Timeline:
This timeline shows a graph from 2007 to 2016 of Bermuda. No data until 2006. Number of actual observations by date: 10.
Source name:
World Development Indicators
Source organization:
International Monetary Fund, Balance of Payments Statistics Yearbook and data files.
Categories, topics:
Economy & Growth, Financial Sector
Last updated:
apr 23, 2017
Indicators value changes by year
Minimum:
-2.812 bln
jan 1, 2009
Maximum:
2.396 bln
jan 1, 2012
At the date of observation
Value
Absolute change
Change from previous value
jan 1, 2007
-588.51 mln
-588.51 mln
0.0%
jan 1, 2008
-5.752 mln
+582.758 mln
-99.02%
jan 1, 2009
-2.812 bln
-2.806 bln
48.79K%
jan 1, 2010
1.638 bln
+4.449 bln
-158.24%
jan 1, 2011
935.842 mln
-701.795 mln
-42.85%
jan 1, 2012
2.396 bln
+1.46 bln
155.99%
jan 1, 2013
-1.06 bln
-3.456 bln
-144.24%
jan 1, 2014
1.613 bln
+2.673 bln
-252.16%
jan 1, 2015
-39.362 mln
-1.652 bln
-102.44%
jan 1, 2016
1.506 bln
+1.545 bln
-3.93K%
Ranking of countries by current statistics by years


Comments: