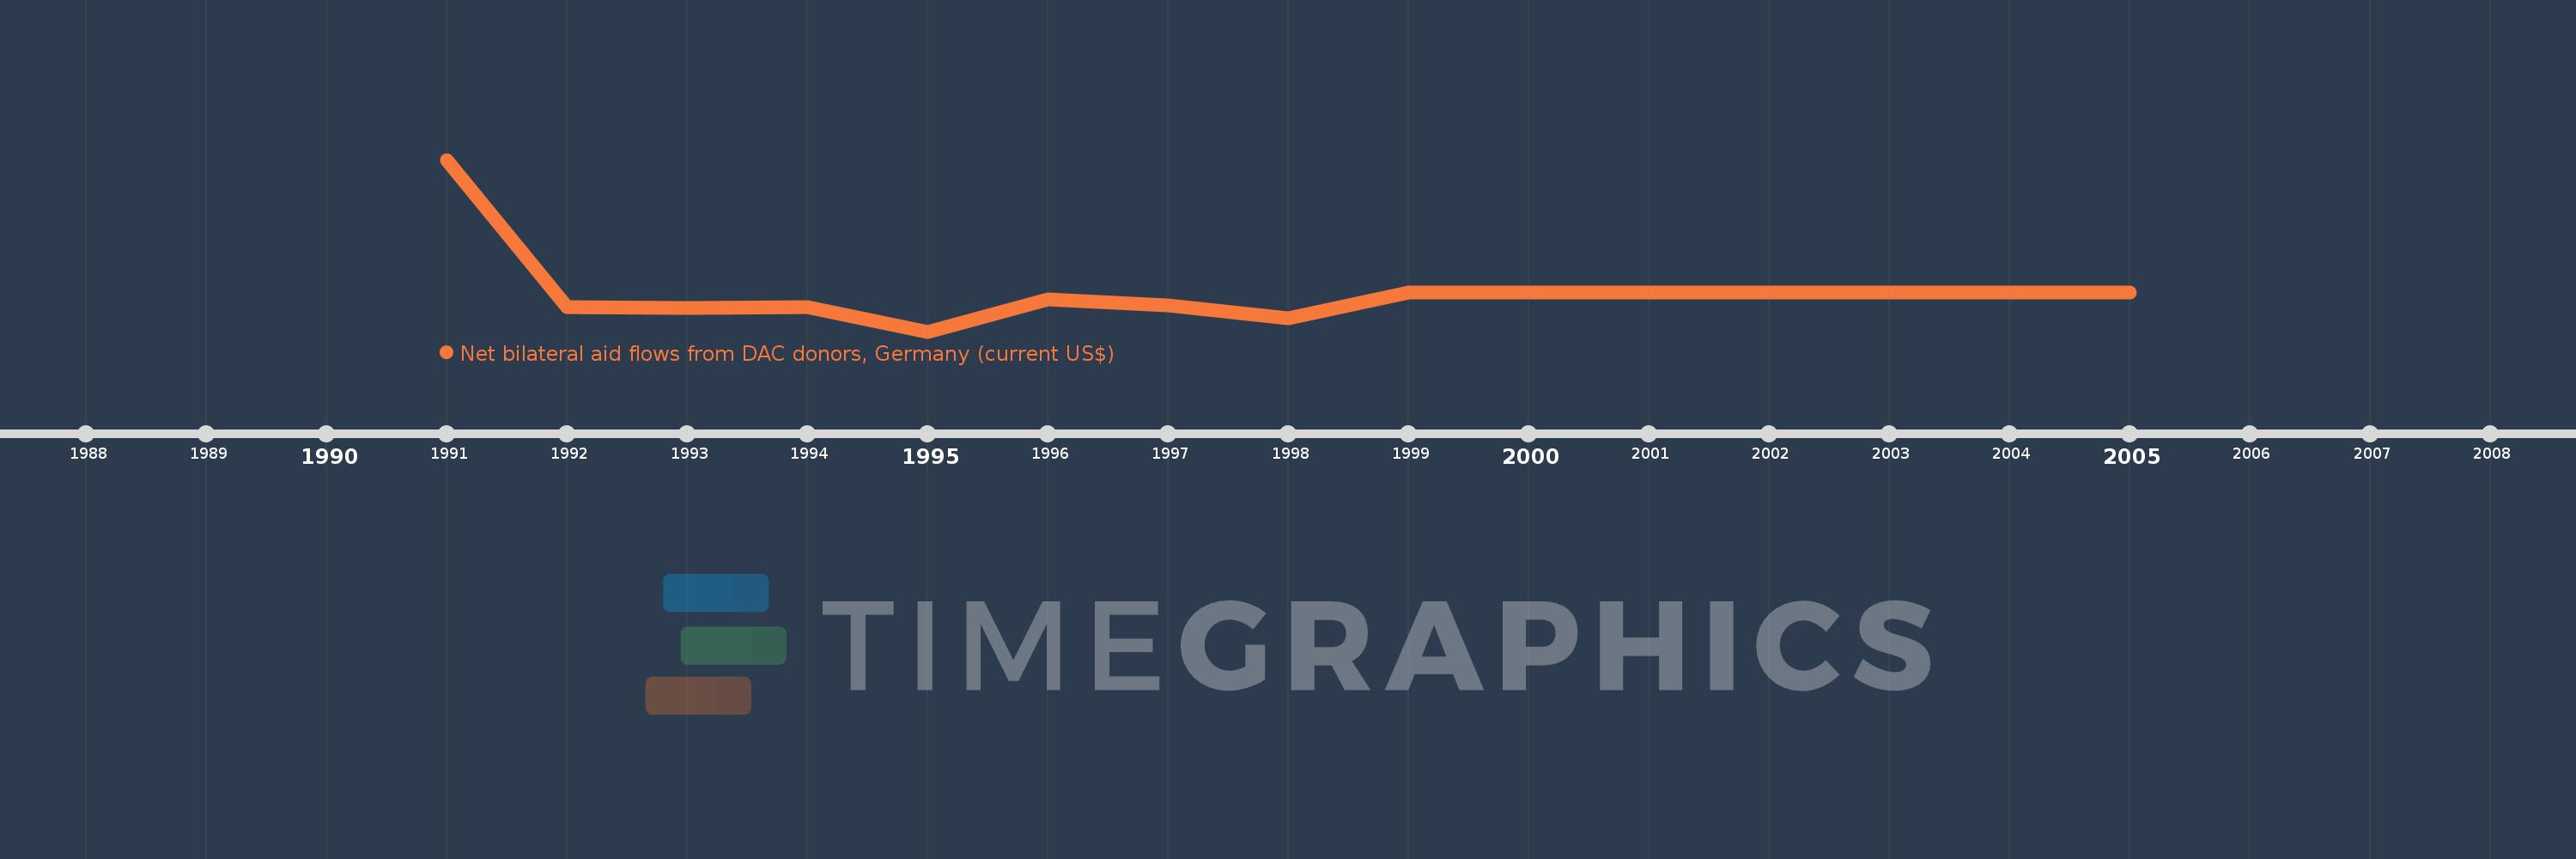
This timeline shows a graph from 1991 to 2005 of Bermuda. No data until 1990. Number of actual observations by date: 13.
Source name:
World Development Indicators
Source organization:
Development Assistance Committee of the Organisation for Economic Co-operation and Development, Geographical Distribution of Financial Flows to Developing Countries, Development Co-operation Report, and International Development Statistics database. Data are available online at: www.oecd.org/dac/stats/idsonline.
Categories, topics:
Aid Effectiveness
Last updated:
apr 23, 2017
Indicators value changes by year
Meaning:
20.769K
Minimum:
-12.5 mln
jan 1, 1995
Maximum:
42.08 mln
jan 1, 1991
At the date of observation
Value
Absolute change
Change from the previous value
jan 1, 1991
42.08 mln
+42.08 mln
0.0%
jan 1, 1992
-4.82 mln
-46.9 mln
-111.45%
jan 1, 1993
-5.13 mln
-310.0K
6.43%
jan 1, 1994
-4.84 mln
+290.0K
-5.65%
jan 1, 1995
-12.5 mln
-7.66 mln
158.26%
jan 1, 1996
-2.17 mln
+10.33 mln
-82.64%
jan 1, 1997
-4.14 mln
-1.97 mln
90.78%
jan 1, 1998
-8.3 mln
-4.16 mln
100.48%
jan 1, 1999
20.0K
+8.32 mln
-100.24%
jan 1, 2000
20.0K
0.0
0.0%
jan 1, 2001
10.0K
-10.0K
-50.0%
jan 1, 2004
10.0K
0.0
0.0%
jan 1, 2005
30.0K
+20.0K
200.0%
Ranking of countries by current statistics by years
