29
/
en
AIzaSyAYiBZKx7MnpbEhh9jyipgxe19OcubqV5w
April 1, 2024
81626
Belgium
BEL
true
2
1
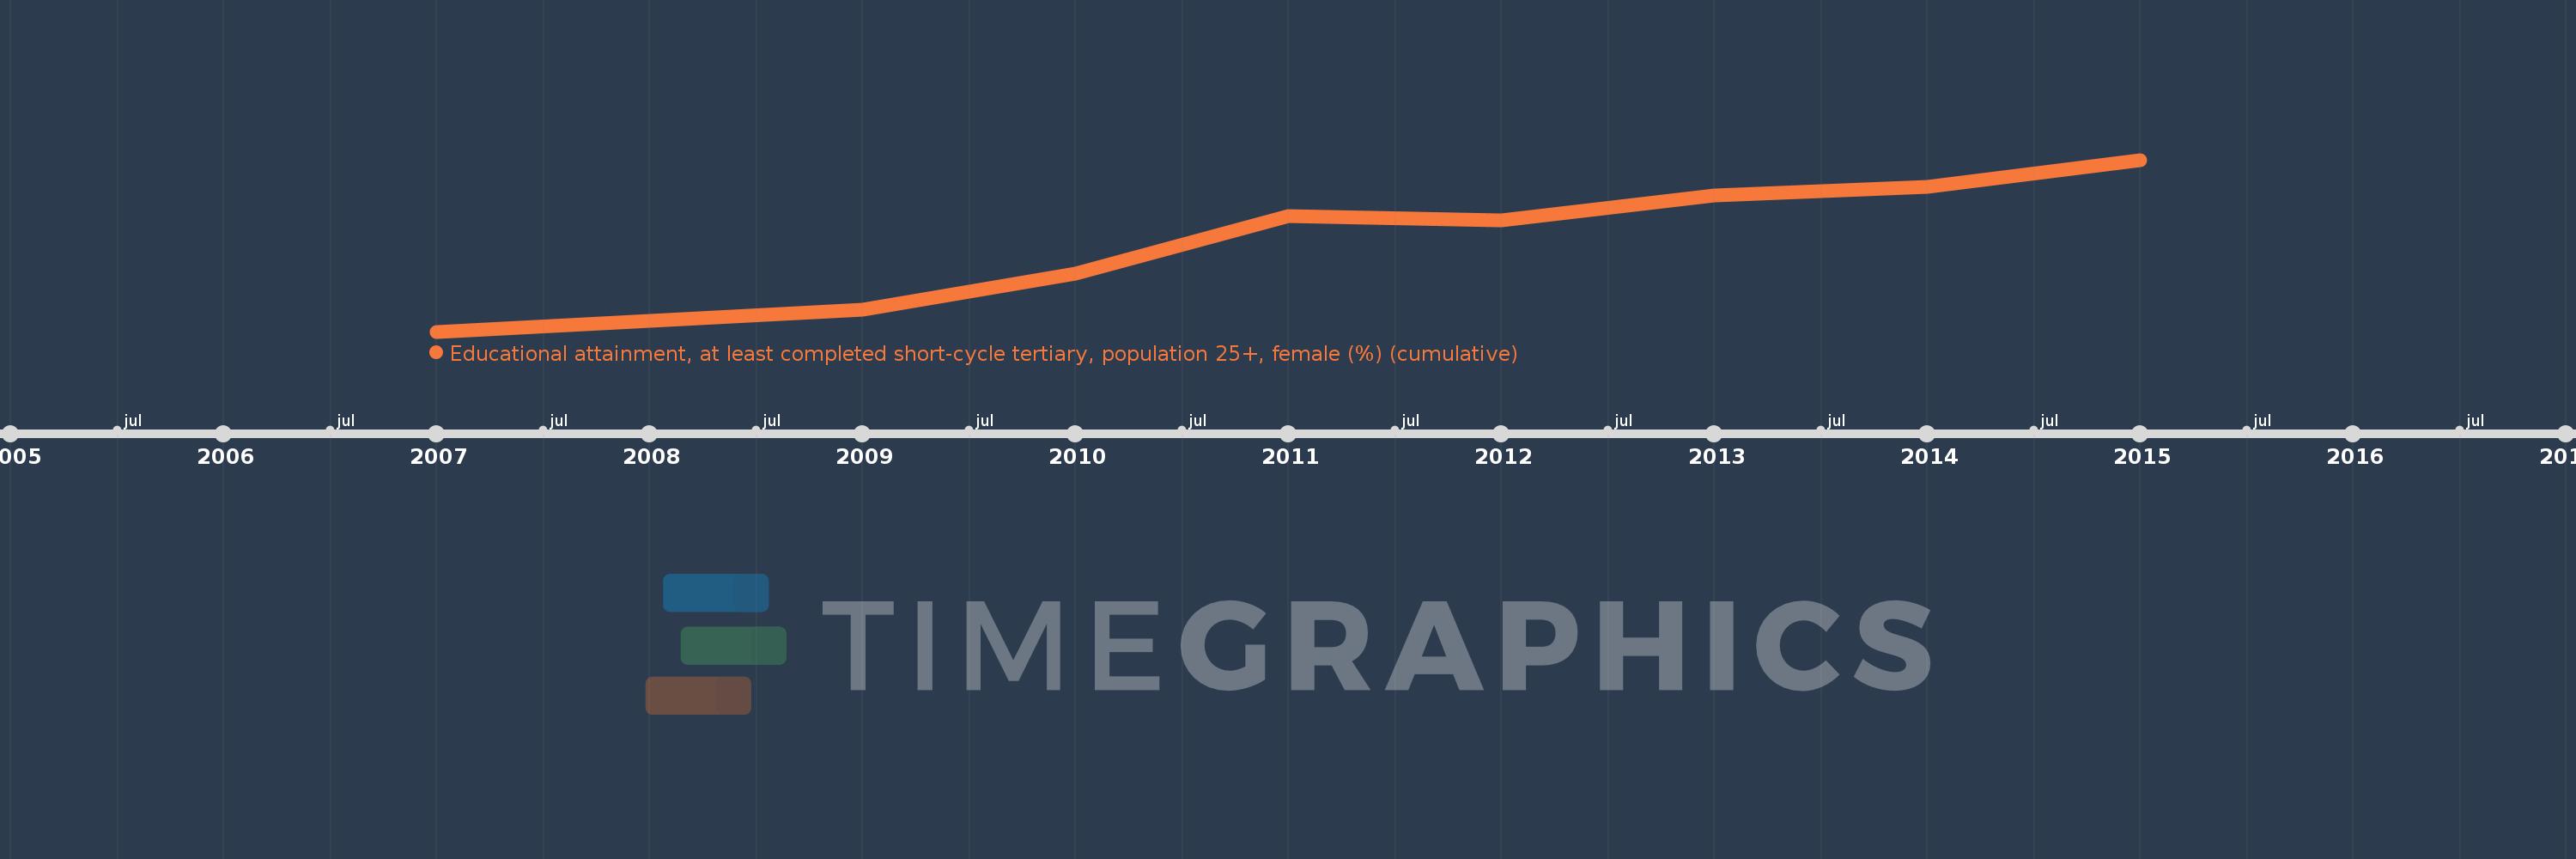
Educational attainment, at least completed short-cycle tertiary, population 25+, female (%) (cumulative)
2015,2014,2013,2012,2011,2010,2009,2007
This statistics in other country:
Timeline:
This timeline shows a graph from 2007 to 2015 of Belgium. No data until 2006. Number of actual observations by date: 8.
Source name:
World Development Indicators
Source organization:
United Nations Educational, Scientific, and Cultural Organization (UNESCO) Institute for Statistics.
Categories, topics:
Education, Gender
Last updated:
apr 23, 2017
Indicators value changes by year
Minimum:
26.385
jan 1, 2007
Maximum:
31.842
jan 1, 2015
At the date of observation
Value
Absolute change
Change from previous value
jan 1, 2007
26.385
+26.385
0.0%
jan 1, 2009
27.072
+0.687
2.6%
jan 1, 2010
28.239
+1.166
4.31%
jan 1, 2011
30.051
+1.812
6.42%
jan 1, 2012
29.905
-0.146
-0.49%
jan 1, 2013
30.722
+0.817
2.73%
jan 1, 2014
30.986
+0.264
0.86%
jan 1, 2015
31.842
+0.857
2.76%
Ranking of countries by current statistics by years


Comments: