29
/
en
AIzaSyAYiBZKx7MnpbEhh9jyipgxe19OcubqV5w
April 1, 2024
81402
Belarus
BLR
true
2
1
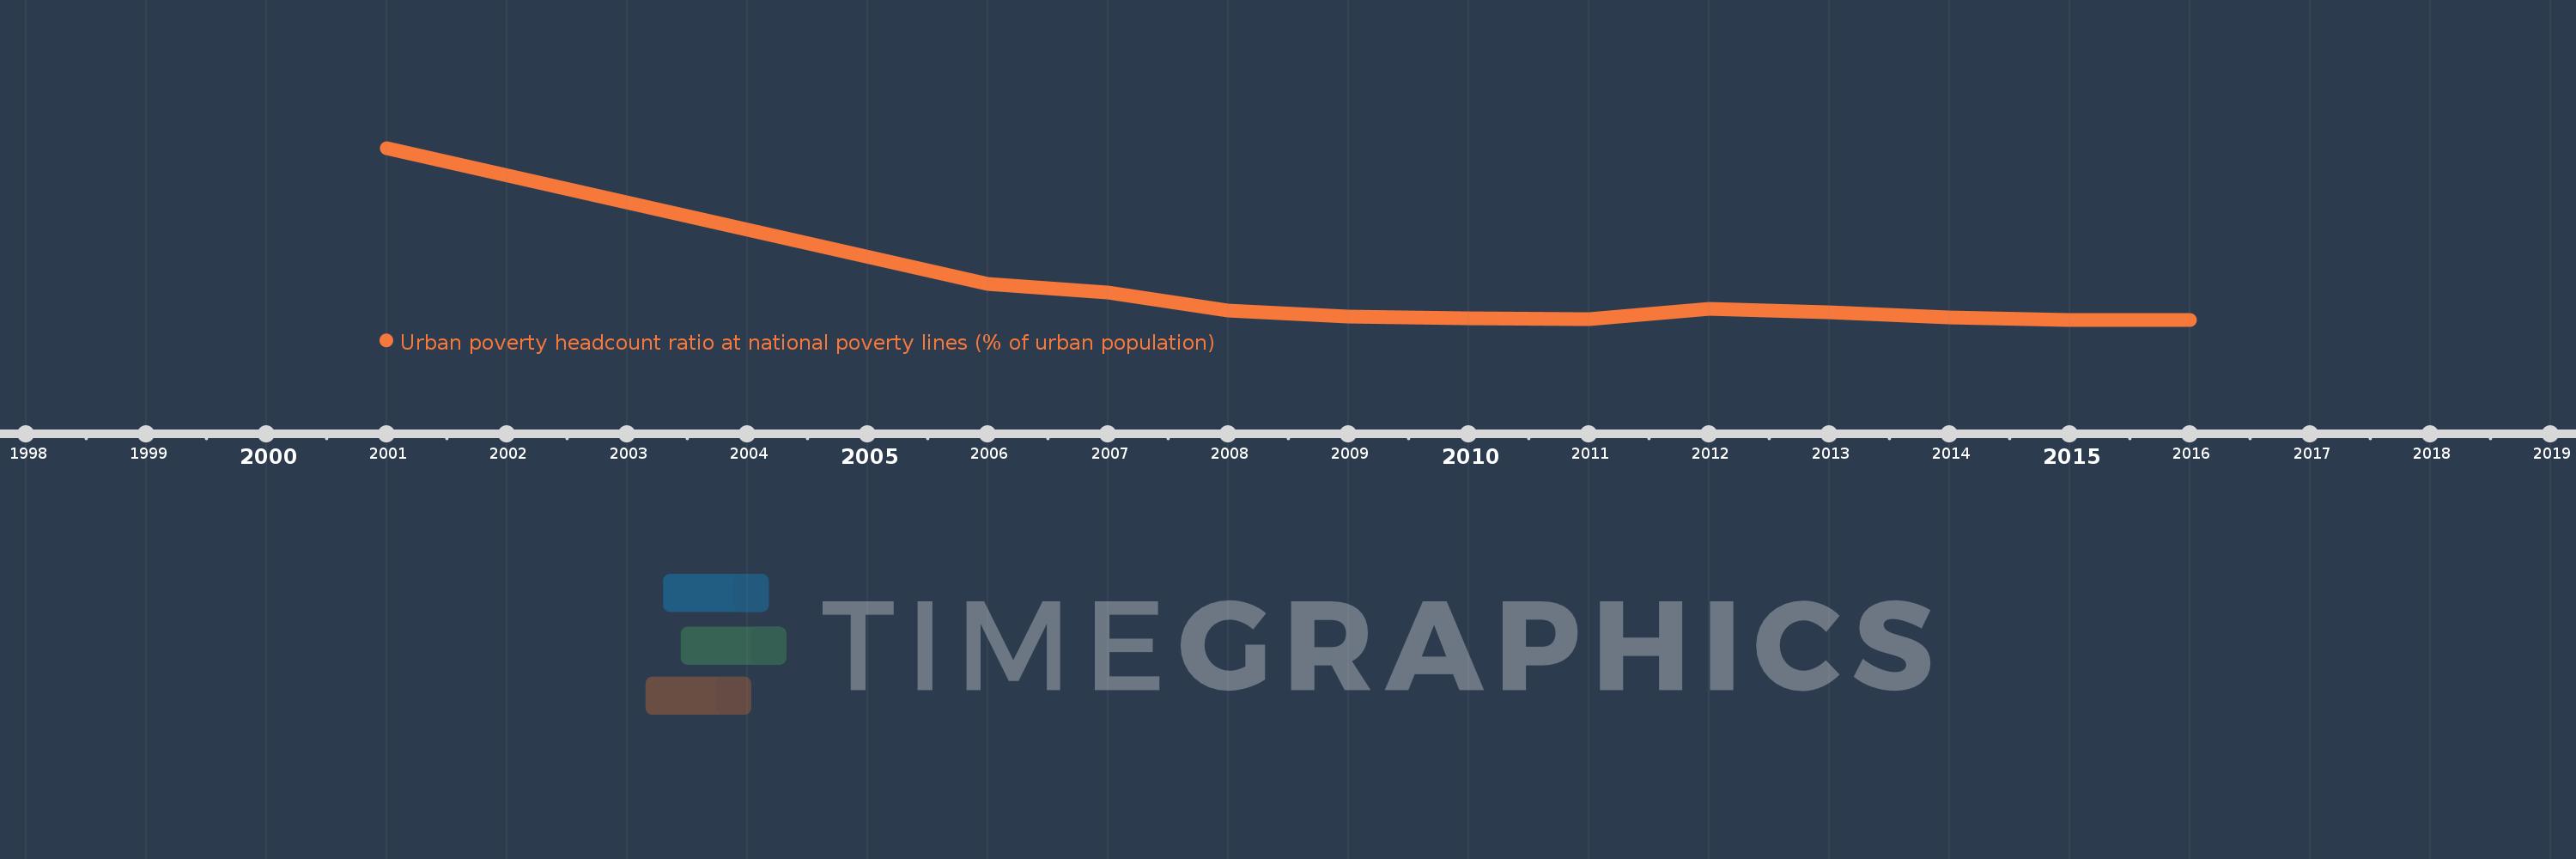
Urban poverty headcount ratio at national poverty lines (% of urban population)
2016,2015,2014,2013,2012,2011,2010,2009,2008,2007,2006,2001
This statistics in other country:
Timeline:
This timeline shows a graph from 2001 to 2016 of Belarus. No data until 2000. Number of actual observations by date: 12.
Source name:
World Development Indicators
Source organization:
World Bank, Global Poverty Working Group. Data are based on World Bank's country poverty assessments and country Poverty Reduction Strategies.
Categories, topics:
Poverty, Urban Development
Last updated:
apr 23, 2017
Indicators value changes by year
At the date of observation
Value
Absolute change
Change from previous value
jan 1, 2001
37.9
+37.9
0.0%
jan 1, 2006
10.9
-27.0
-71.24%
jan 1, 2007
9.1
-1.8
-16.51%
jan 1, 2008
5.6
-3.5
-38.46%
jan 1, 2009
4.4
-1.2
-21.43%
jan 1, 2010
4.0
-0.4
-9.09%
jan 1, 2011
3.8
-0.2
-5.0%
jan 1, 2012
5.8
+2.0
52.63%
jan 1, 2013
5.2
-0.6
-10.34%
jan 1, 2014
4.2
-1.0
-19.23%
jan 1, 2015
3.7
-0.5
-11.9%
Ranking of countries by current statistics by years


Comments: